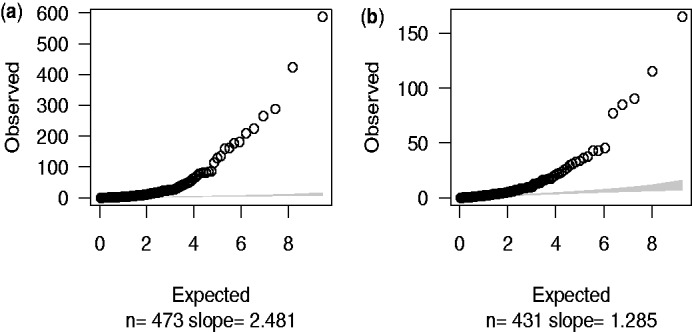
Fig. 3.

Fisher’s exact test statistics. The observed  values were calculated by using Fisher’s P-value to calculate quantiles of
  distribution. Expected values were random quantiles in
  distribution with df = 1. In this and subsequent quantile–quantile plots, the shaded region is the 95% concentration band. (a) 473 SNPs after initial filtering. (b) 431 SNPs after further filtering by chromosome coverage
