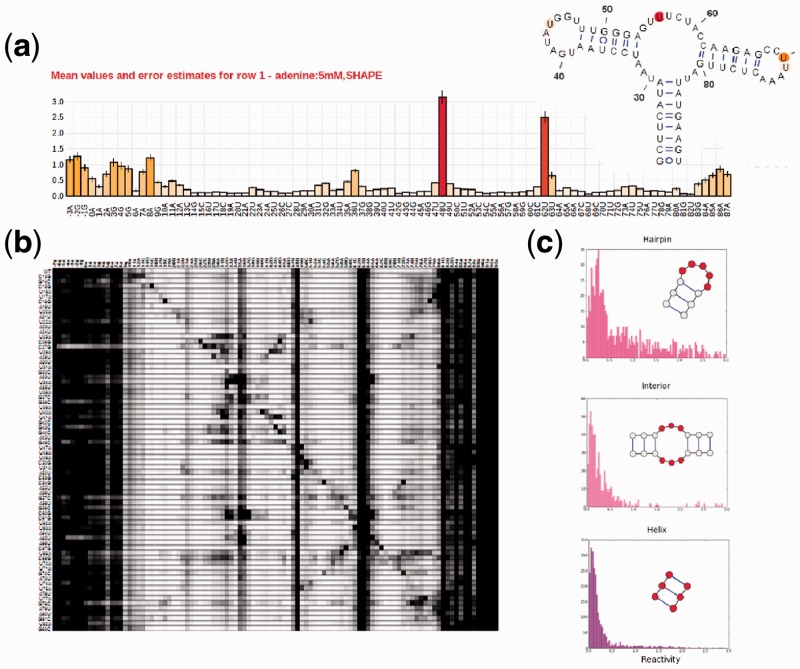
Fig. 1.
Different visualization tools for entries in the RNA mapping database. (a) Classic bar plot of 2′-OH acylation (SHAPE) rates across the nucleotides of the adenine-sensing domain of the add riboswitch from Vibrio vulnificus. The data are from a ‘standard state’ study averaging 19 replicates across multiple experiments and estimating the resulting errors (shown as error bars); the RNA’s crystallographic secondary structure, colored by the SHAPE data, is shown in the inset. (b) Through mutate-and-map data, the RMDB also allows exploring the contact map of the same riboswitch. SHAPE data are shown for constructs with single mutations at each RNA position. (c) Histograms for reactivities found in interior loops, hairpin loops and helices. Nucleotides in the motif for which reactivity data were collected are marked in red. Hairpin loops have higher average reactivities than interior loops, bulges and non-helical elements

