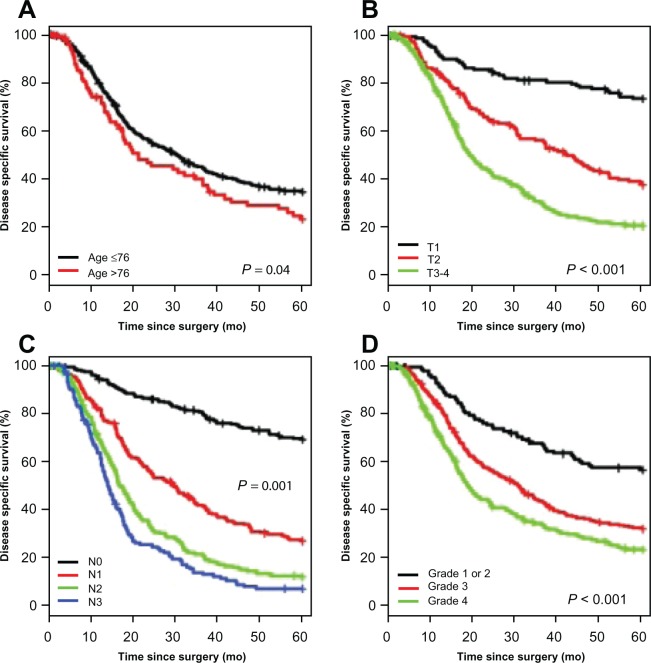
Figure 3.
Kaplan–Meier curves for disease-specific survival by age (A), T status (B), N status (C), and grade (D). Reprinted from Yoon HH, Khan M, Shi Q, et al. The prognostic value of clinical and pathologic factors in esophageal adenocarcinoma: a mayo cohort of 796 patients with extended follow-up after surgical resection. Mayo Clin Proc. 2010;85(12):1080–1089.59 With permission from Elsevier.

