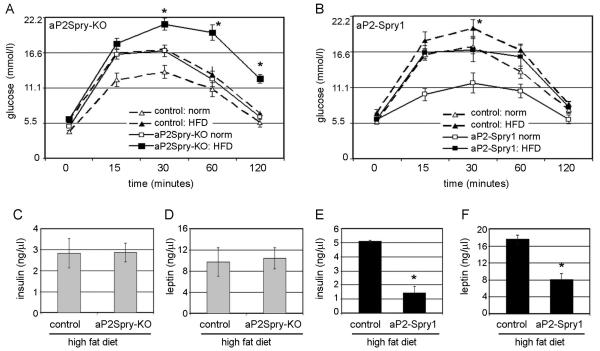
Figure 3. Spry1 expression protects from diet induced metabolic abnormalities.
Glucose tolerance test was performed on aP2Spry-KO (A) and aP2Spry1 overexpressing mice (B) fed a normal diet (norm) or high fat diet (HFD) at 20 weeks of age. Blood glucose levels were recorded at 0, 15, 30, 60 and 120 minutes after intraperitoneal injection of glucose to overnight fasted mice (n≥8). All groups underwent blood serum analysis to quantify circulating insulin (C, E) and leptin (D, F) after high fat feeding (n≥8). Bars indicate means ± SD. Asterisks indicates p<0.005.

