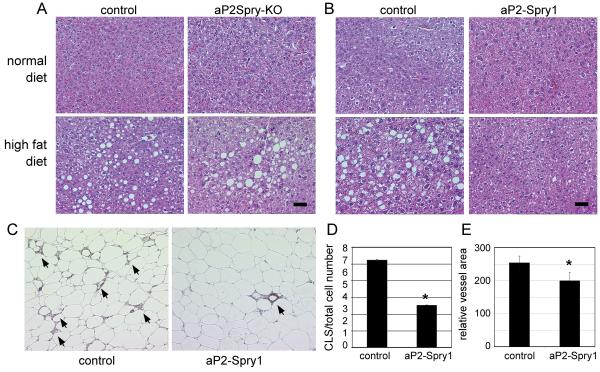
Figure 4. Spry1 expression protects from conditions of fatty liver and inflammation.
(A) Liver tissue samples were collected from the aP2Spry-KO group and respective control on a normal or high fat diet. Histological staining with hematoxylin/eosin shows adipocyte ghost cells, which are remnants of lipid filled adipocytes characteristic of fatty liver condition. Scale bar = 50μm. B) aP2-Spry1 transgenics and single transgenic controls were compared similarly. Scale bar = 50μm. C) Immunohistochemistry using F4/80 antibody to detect macrophage infiltration in abdominal adipose tissue in controls and aP2-Spry1 mice on a high fat diet. Arrows indicate cluster like structure (CLS) formations indicative of macrophage surrounding dead or dying adipocytes. D) CLS were quantified and normalized to total cell numbers for each group indicated. CLS were significantly decreased in aP2-Spry1 adipose tissue (p<0.05). Bars indicate means ± SD. E) Adipose tissue sections were stained for PECAM-1 to quantify the vasculature. aP2-Spry1 transgenic mice had reduced vascular area compared to controls (p<0.05). Bars indicate means ± SD. Asterisks indicates p<0.05.

