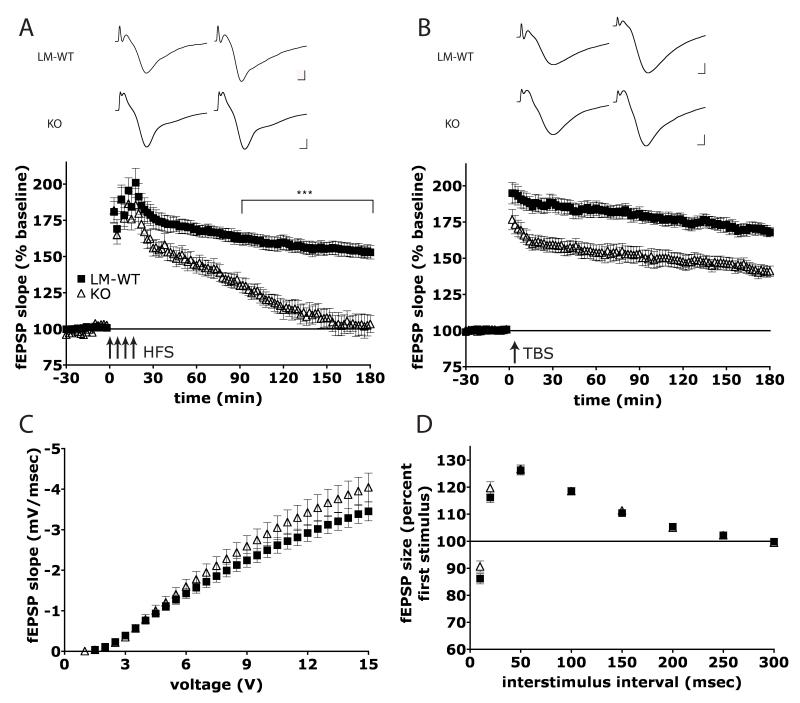
Figure 1.
Homer1 KO mice display LTP deficits in the CA1 region. (A) HFS results in a reduction of L-LTP in H1-KO mice; (n = 7(3), i.e. 7 slices from 3 animals) relative to LM-WT (n = 10(3)). (B) H1-KO mice (n = 11(3)) show a reduced level of maintenance by TBS when compared to LM-WT (n = 9(4)). (A, B - Top): Representative EPSPs for each experimental group are shown (left: 4 min prior to stimulation, right: 180 min after stimulation). Calibration 1 mV, 1 ms. (C) No difference in synaptic transmission is observed in H1-KO (n = 35(9)) when compared to LM-WT (n = 52(14)) as determined by the input/output relationship. (D) KO animals display normal PPF when compared to LM-WT (same n values as for I/O curve).

