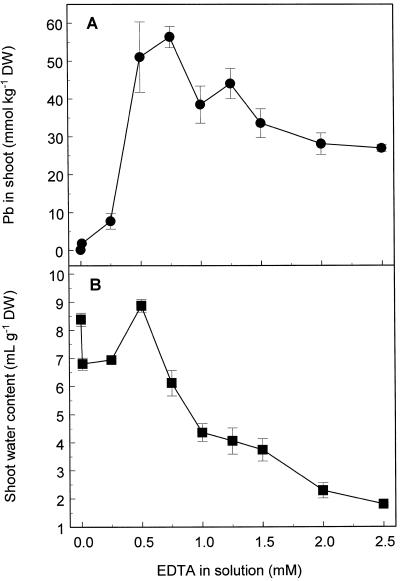
Figure 1.
Pb accumulation (A) and water content (B) of shoots of Indian mustard exposed to 0.5 mm Pb(NO3)2 and various K2EDTA concentrations for 48 h. Values represent the mean ± se of three replicate samples, and the data presented are from one experiment representative of three independent experiments. DW, Dry weight.

