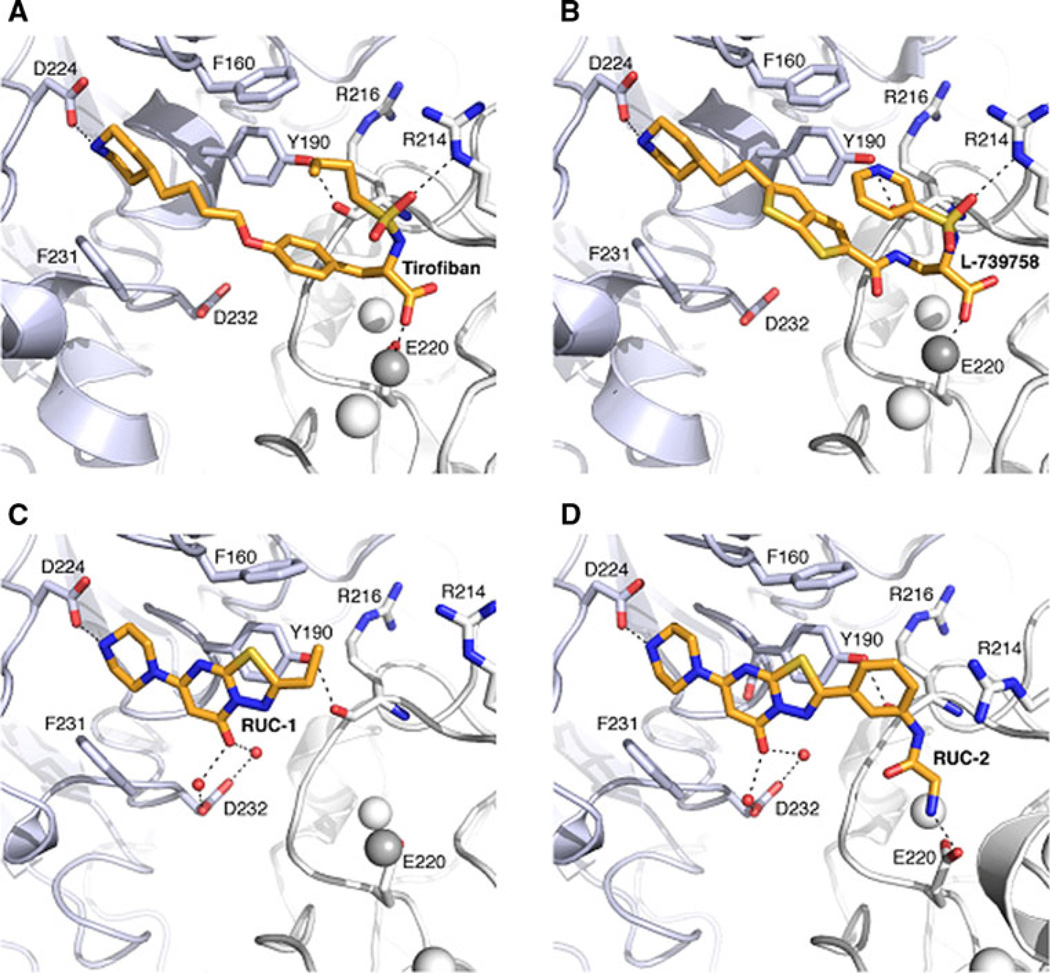
Fig. 2.
Crystallographic binding modes of antagonists tirofiban, L-739758, RUC-1, and RUC-2 (A, B, C and D, respectively). The αIIb and β3 subunits are shown as light blue and white cartoons, respectively. Side chains of protein residues interacting with the ligands are shown as sticks. ADMIDAS and SyMBS ions are shown as white spheres while the MIDAS ion is shown as a grey sphere. Ligands are shown as orange sticks, while black dot lines indicate hydrogen bonds

