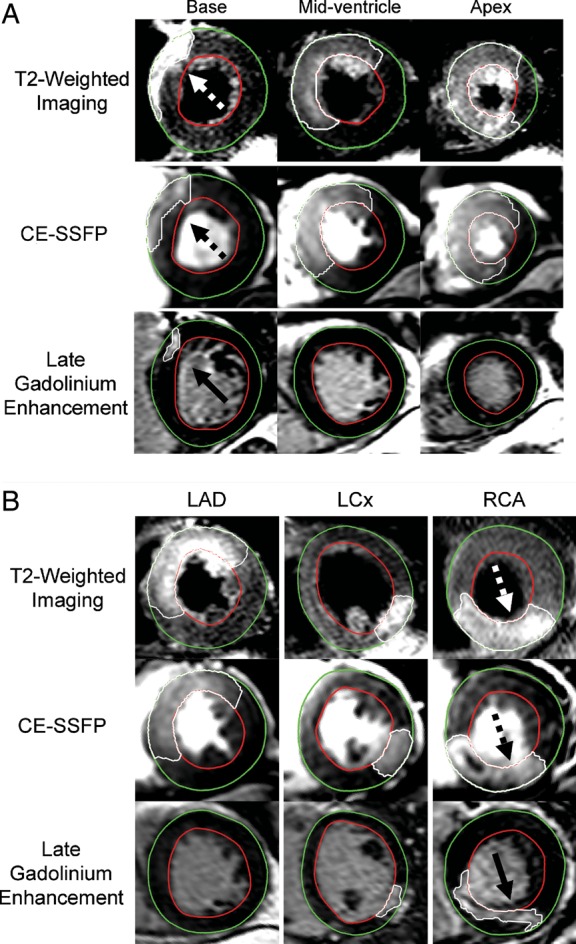
Figure 1.

The myocardium at risk by T2-weighted imaging and CE-SSFP, and the infarct size by late gadolinium enhancement. (A) T2-weighted, CE-SSFP, and late gadolinium-enhanced short-axis images at the corresponding LV levels in a patient with a reperfused left anterior descending coronary artery occlusion. (B) Single corresponding mid-ventricular short-axis images from a patient with an occlusion in the left anterior descending coronary artery (LAD), left circumflex coronary artery (LCx), and the right coronary artery (RCA), respectively. The epicardium is traced in green and the endocardium is traced in red. The hyperenhanced regions constituting the myocardium at risk (dashed arrows) and the infarcted myocardium (solid arrows) are traced in white. Note the similarity in location and the extent of the affected region between T2-weighted imaging and CE-SSFP. Also note the significantly smaller infarction compared with the myocardium at risk indicating a significant myocardial salvage accomplished by the acute reperfusion therapy. CE-SSFP, contrast-enhanced steady-state free precession.
