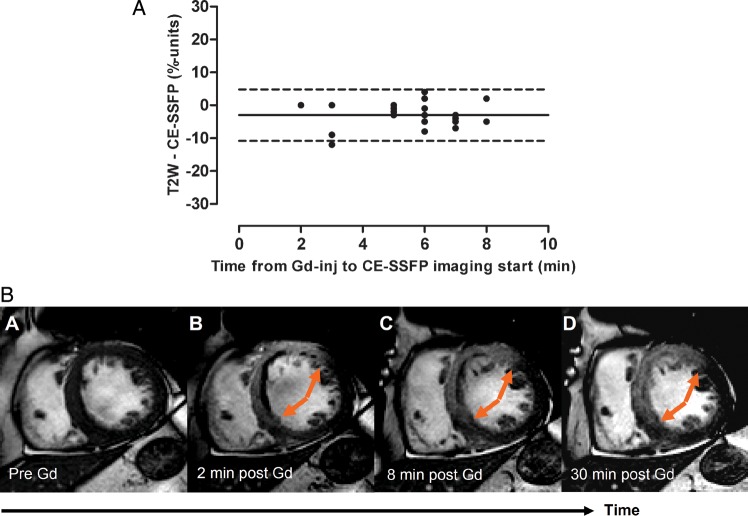
Figure 3.
The MaR by CE-SSFP as a function of time after Gd administration. (A) The difference between MaR by T2-weighted imaging and CE-SSFP as a function of time after contrast agent administration at which the CE-SSFP imaging was commenced. The relationship between MaR by T2-weighted imaging and CE-SSFP was not affected by increased time after contrast injection at which the CE-SSFP was commenced. (B) An example of a patient with an infarction within the LAD territory. It is shown that no hyperenhancement could be seen prior to Gd administration (A), whereas a hyperenhanced region was seen 2, 8, and 30 min after Gd administration (B–D). Note that the extent of hyperenhancement did not change during the first 30 min after Gd injection (arrows). CE-SSFP, contrast-enhanced steady-state free precession; Gd-inj, gadolinium contrast agent injection; T2W, T2-weighted imaging; solid line, mean difference; dashed lines =± 2SD.

