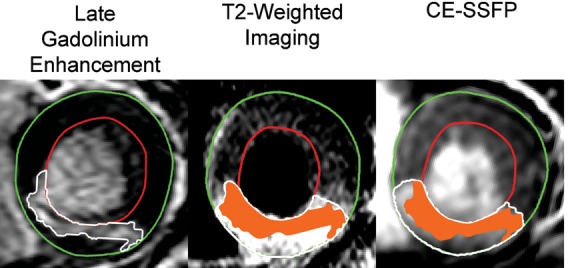
Figure 4.

Graphical display of myocardial salvage. Mid-ventricular short-axis slices in a patient with a right coronary artery occlusion. The epicardium is traced in green, the endocardium is traced in red, and the affected region is traced in white. The infarcted myocardium on the late gadolinium-enhanced image is superimposed (orange) on the myocardium at risk within the T2-weighted image and the CE-SSFP image. The non-coloured part of the myocardium at risk defines the salvaged myocardium. For this patient, T2-weighted imaging and CE-SSFP showed 52 and 55% myocardial salvage, respectively. CE-SSFP, contrast-enhanced steady-state free precession.
