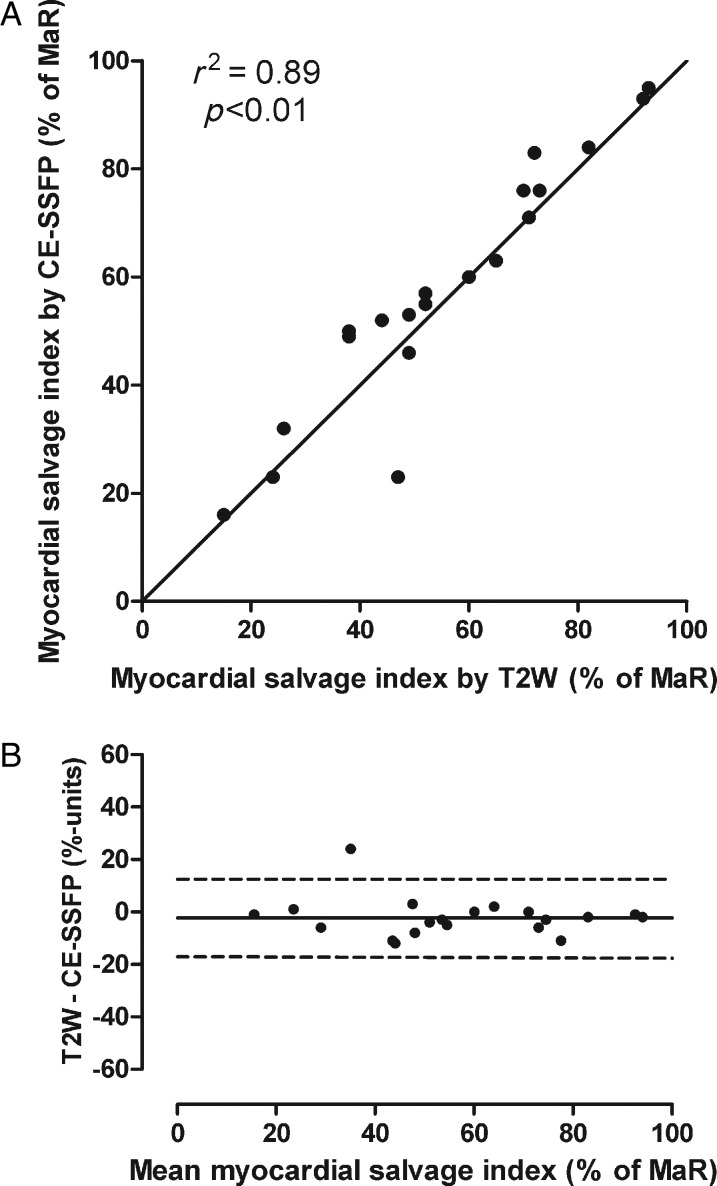
Figure 5.
Myocardial salvage by T2-weighted imaging and CE-SSFP. (A) The myocardial salvage index measured by T2-weighted imaging vs. myocardial salvage index measured by CE-SSFP; the solid line denotes the line of identity. (B) The Bland–Altman graph showing the difference between myocardial salvage index quantified by T2W and CE-SSFP vs. the mean of the two methods. The difference between T2W and CE-SSFP was −2.3 ± 7.4%; the solid line denotes the mean difference; dashed lines represent ±2SD. CE-SSFP, contrast-enhanced steady-state free precession; LV, left ventricle; MaR, myocardium at risk; T2W, T2-weighted imaging.

