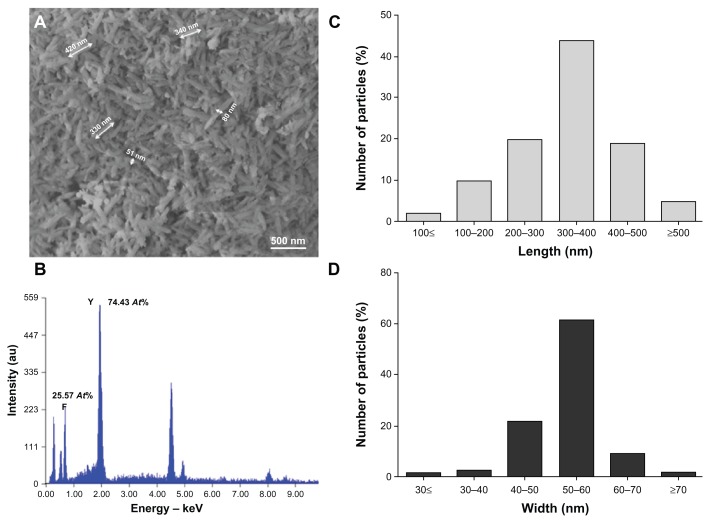
Figure 2.
YF3 NP characterization. (A) SEM micrograph and (B) X-ray elemental spectra of YF3 NPs. Percentages indicated in (B) refer to the relative atomic ratio between fluor and yttrium atoms. (C and D) Nanoparticle length and width distributions.
Abbreviations: NP, nanoparticle; SEM, scanning electron microscope; YF3, yttrium fluoride.

