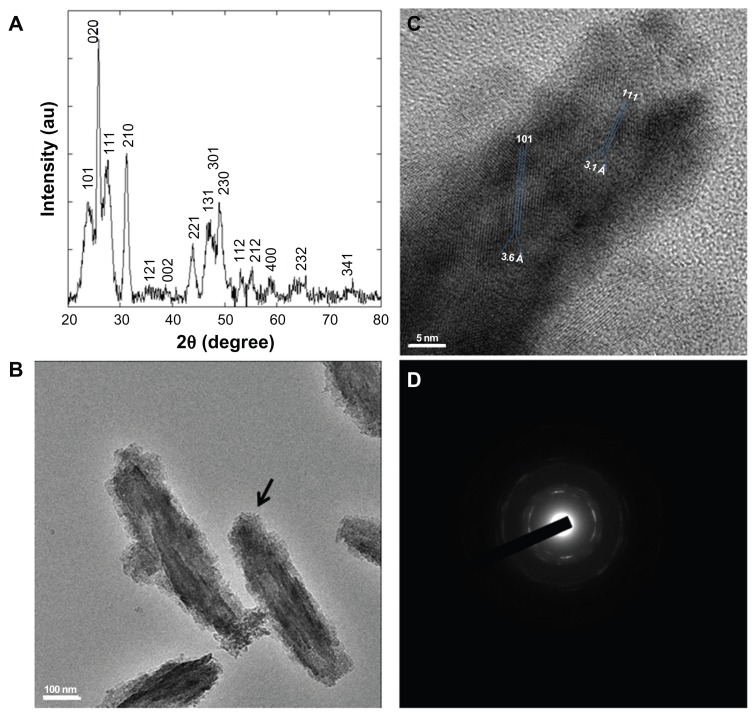
Figure 3.
YF3 NP crystallinity characterization. (A) Powder XRD analysis of the crystalline NPs. The XRD pattern matched the reflection peaks and relative Miller indices of orthorhombic YF3. (B) HR-TEM micrographs of YF3 NPs and (C) characteristic lattice fringes of the crystalline phases indicated by the black arrow in (B). (D) Selected area diffraction patterns of polycrystalline YF3 NPs shown in (B).
Abbreviations: HR-TEM, high-resolution transmission microscope; NP, nanoparticle; XRD, X-ray diffraction; YF3, yttrium fluoride.

