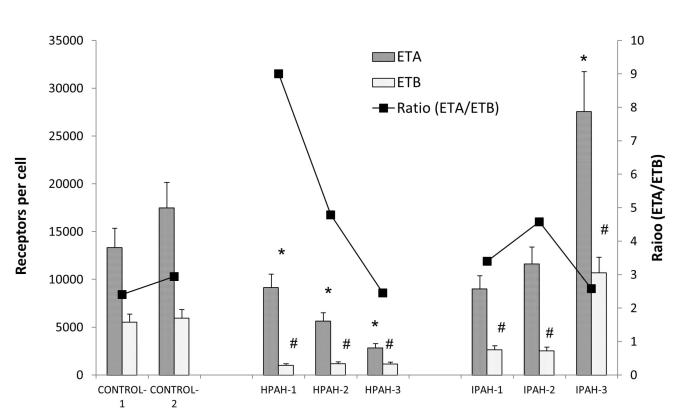
Figure 4. ETA and ETB receptor sites per cell in control and PAH PASMC.
The receptor sites per cell were determined as described in the Material and Methods. The ratio of ETA/ETB is presented as a line graph. * p < 0.05 compared with the ETA sites per cell in CONTROL-1 PASMC. # p < 0.05 compared with the ETB sites per cell in CONTROL-1 PASMC.

