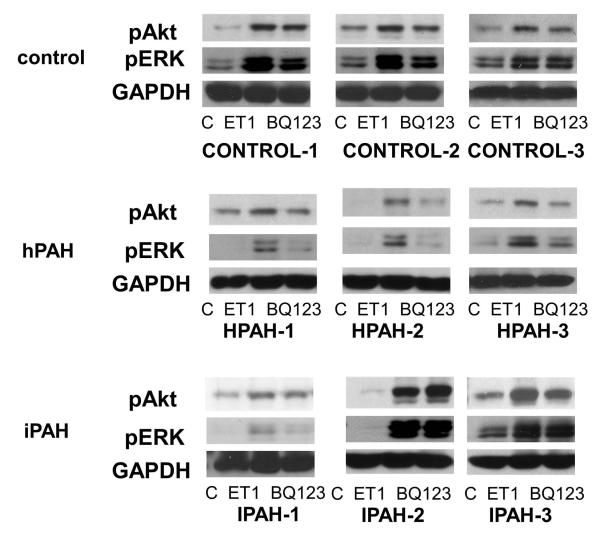
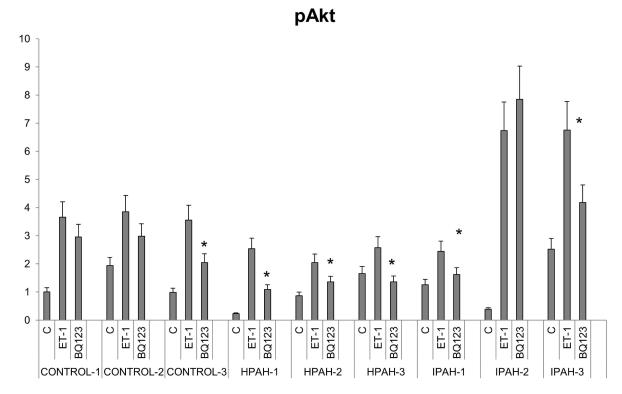
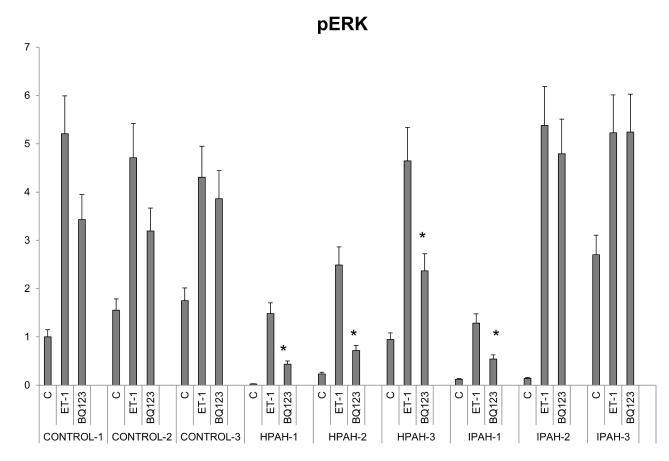
Figure 8. ERK and Akt activation in the human PASMC.
A. Human PASMC from control and PAH subjects were incubated with or without 10 nM ET-1 for 5 minutes with or without 1 uM BQ123. After incubation, the cytosolic extracts were isolated and analyzed by Western blot. GAPDH was used as a loading control. B. The quantitation of the p-Akt is illustrated as a bar graph which shows fold change in spot intensity of the bands normalized with GAPDH with basal level as 1. * p< 0.05 compared with WT. C. The quantitation of the p-ERK is illustrated as a bar graph using the same procedure as previously described.


