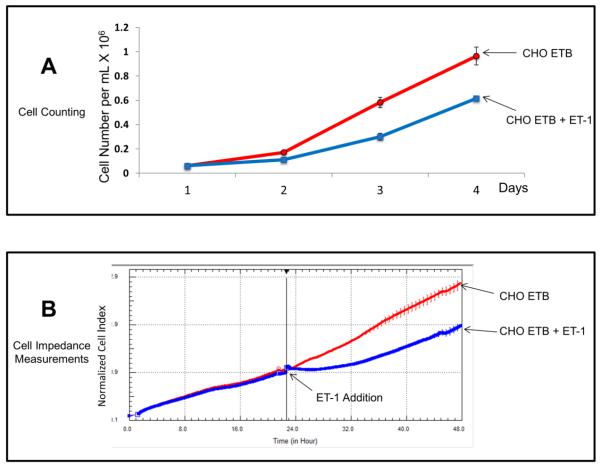
Figure 1. Growth curves of transfected CHO ETB cells with treatment of 10 nM ET-1.
(A) Growth curve of CHO ETB cells by direct counting over 4 days. ET-1 was added on day 1 and replenished on day 2 and 3. Each point represents the cell count average and the error bars are the standard deviation. (B) Growth curve of CHO ETB cells by real-time cell impedance measurements. ET-1 was added 24 hours after cells were seeded. To offset any small differences in cell growth before ET-1 addition, cell index values were normalized in the graph after ET-1addition. All points in the curves represent the normalized cell index average and the error bars are the standard deviation.

