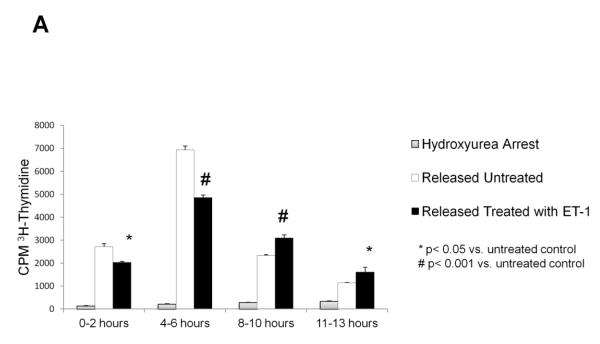
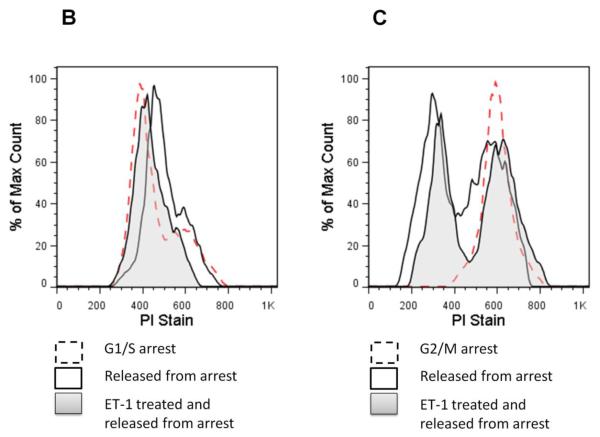
Figure 2. Effects of ET-1 on cell cycle progression in CHO ETB.
(A) Effects of ET-1 on S phase progression in CHO ETB cells using [3H]-thymidine incorporation. All cells were arrested in late G1 of the cell cycle by treatment with 2 mM hydroxyurea for approximately 24 hours. All cells were then pulsed with [3H]-thymidine for 2 hours at the indicated time intervals after being either not released from arrest or released from arrest with or without 10 nM ET-1. Bar height indicates the counts per minute (CPM) average and the error bars are the standard deviation. *p< 0.05 vs. untreated control, #p< 0.001 vs. untreated control. (B,C) Progression of ET-1 treated CHO ETB cell transit from G1/S arrest (B) or G2/M arrest (C). Progression was determined with flow cytometry. Dashed lines indicate cells arrested at G1/S by hydroxyurea (B) or at G2/M by nocodazole (C). Solid lines indicate cells 6 hours after release from arrest, tinted lines indicate cells 6 hours after release from arrest with 10 nM ET-1 treatment. Propidium iodide, PI, stain was measured as a histogram of FL2A after gating out debris and aggregates.


