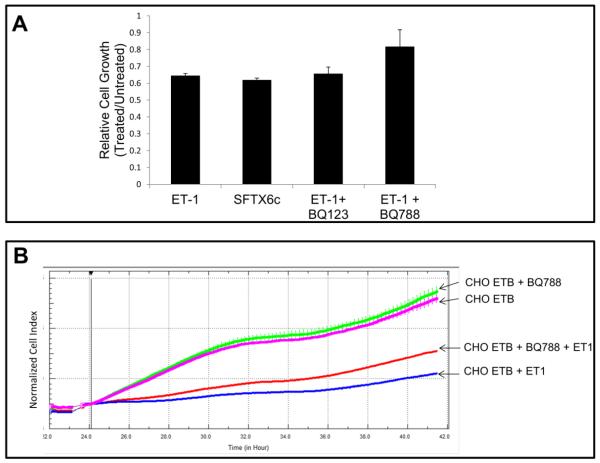
Figure 4. Relative growth of CHO ETB cells treated with ET-1 agonists and antagonists.
(A) Relative growth of cells by counting cells treated with 10 nM ET-1, 10 nM SFX6c, 10 nM ET-1 and 1 mM BQ123, or 10 nM ET-1 and 0.5 mM BQ788 after 1 day. For relative cell growth, CHO ETB treated and untreated cells were counted in triplicate and the average of the cell counts for the treated were divided by the average cell counts for the untreated. This experiment was then performed in duplicate with the bars representing the average between the two relative cell growth values and the error bars representing the standard deviation of those values. (B) Real-time growth of CHOETB treated with 0.5 mM BQ788 and/or 10 nM ET-1 in growth medium. Inhibitor was added about 24 hours after cells were seeded and agonist was added an hour later. To offset any small differences in cell growth before agonist addition, cell index values were normalized in the graph after agonist addition. All points in the curves represent the normalized cell index average and the error bars are the standard deviation.

