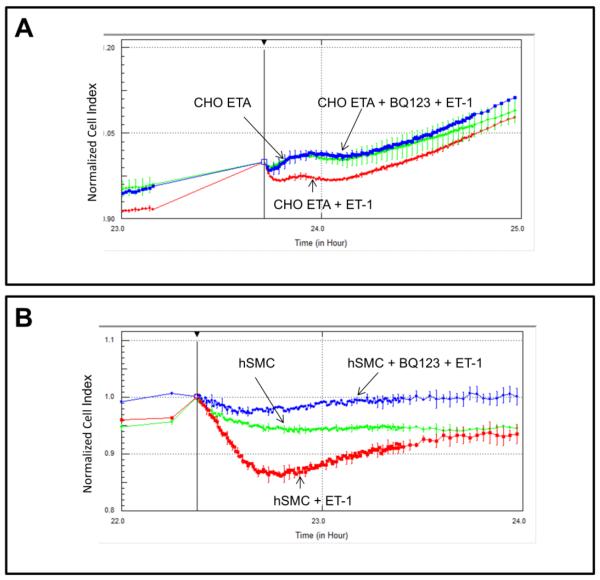
Figure 7. Comparison of ET-1 induced morphological effects on CHO ETA (A) and hSMC (B) by cell impedance measurements.
Cells were pre-incubated with or without 1 uM BQ123 for 1 hour 24 hours after seeding, followed by 10 nM ET-1 addition. All points in the curves represent the normalized cell index average and the error bars are the standard deviation.

