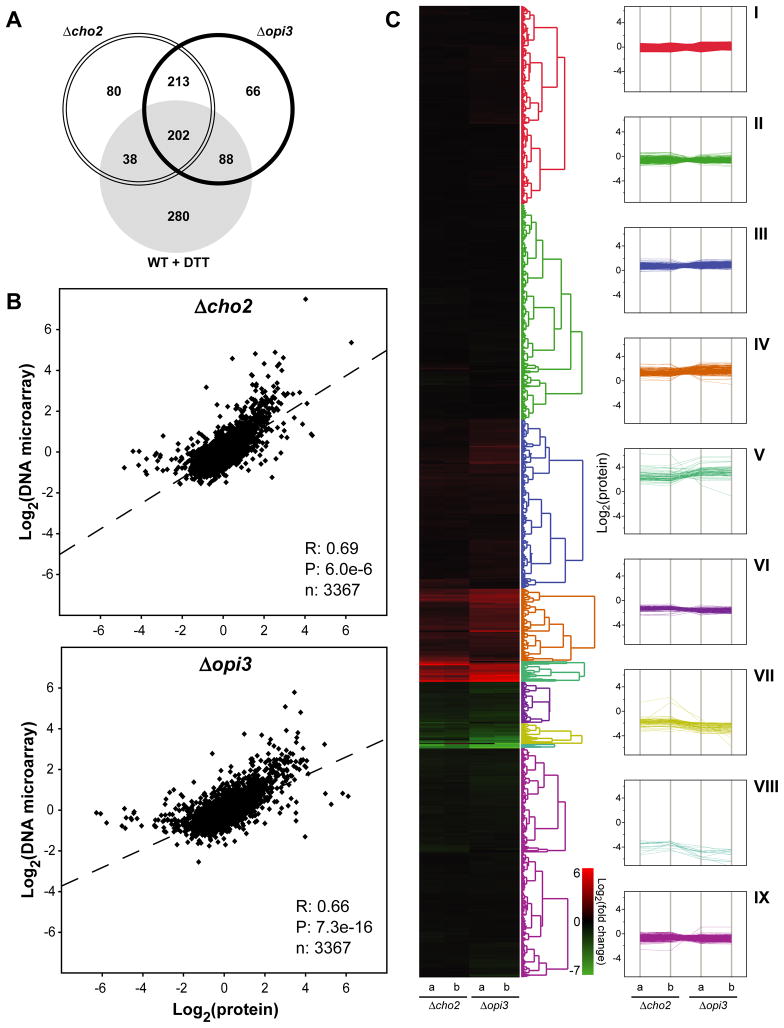
Figure 2. Genomic and proteomic cellular response to lipid disequilibrium.
(A) Venn diagram representation of upregulated genes at a minimum of two folds compared to untreated WT cells. Total RNA was extracted from cells grown to early log phase at 30°C. Probes were prepared using Low Input Quick Amp Labeling System with 100 ng of total RNA as starting material following manufacturer instruction. (B) Pearson correlation of relative protein and RNA abundance. R, Pearson correlation; P, p-value. (C) Hierarchical clustering of Log2 levels for each protein in Δcho2 and Δopi3 (left panel) and parallel coordinate plot of the nine major clusters (right panel). Major GO terms for plots i to ix are listed in Table S2.

