
Figure 3.
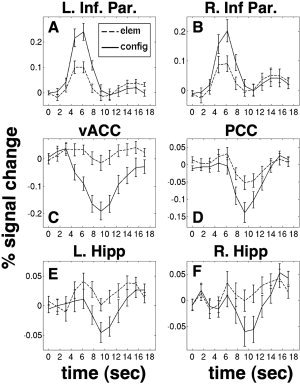
Timecourses of regions showing a main effect. A: Left inferior parietal lobe, MNI coordinates X = −34, Y = −56, Z = 44. This region was positively activated in the block‐design comparison, as a result of a hemodynamic transient peaking at about 6 s. Error bars represent standard error of the mean across subjects. B: Right inferior parietal lobe, (coords. 33, −60, 44), also positively activated. C: Ventral anterior cingulate cortex, (coords. 0, 43, 1), deactivated on the block level because of a later negative transient peaking at about 10 s. D: Posterior cingulate, (coords. 0, −36, 40), also deactivated due to a late transient. E: Left hippocampus, (coords. −32, −25, −16), deactivated. F: Right hippocampus (coords. 28, −29, −18), deactivated.