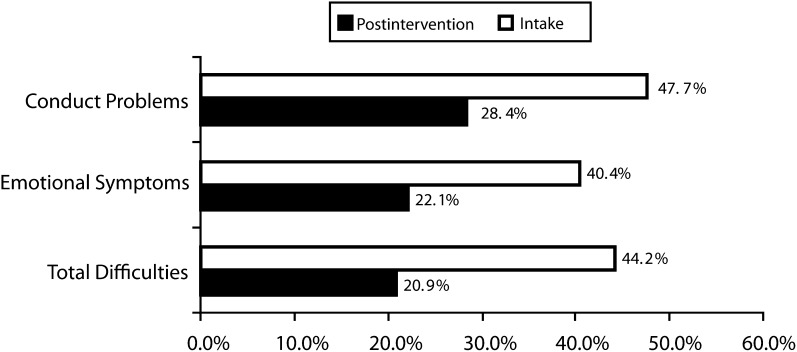
FIGURE 2.
Reduction in prevalence of child symptoms by phase (intake or postintervention): Families OverComing Under Stress, United States and Japan, July 2008–February 2010.
Note. The single-sample t-test against null hypothesis (no change) was significant (P < .001) for all scales. Subscales are from the Strengths and Difficulties Questionnaire.46 Per the manual, the cutoff for “normal,” conduct problems: 2; emotional symptoms: 3; total difficulties: 13. Percentages greater than normal are shown.

