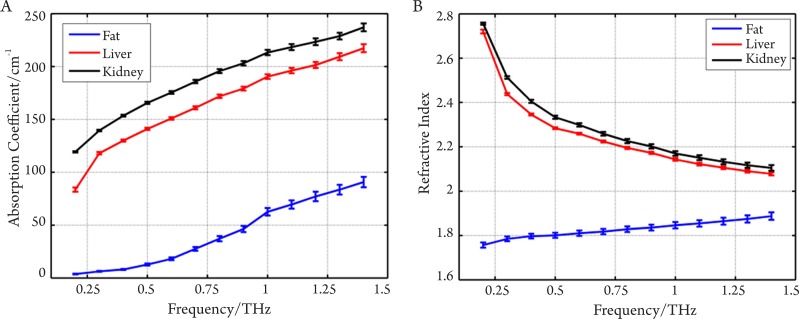
Figure 5. A: Mean absorption coefficients of kidney, liver and abdominal fat; B: Mean refractive indices of all the tissue samples.
Error bars represent 95% confidence intervals. Having looked at how healthy tissues can be differentiated using THz spectroscopy, in the next sections we look at investigations involving cancer tissue samples.

