Figure 1.
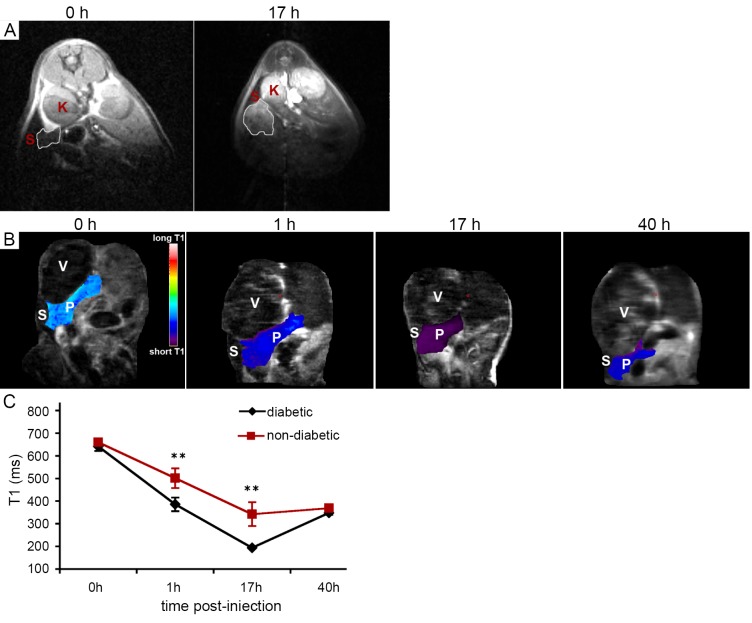
T1-weighted MRI of PGC-GdDTPA-F accumulation in the diabetic pancreas. A. Transverse T1-weighted MRI of an STZ induced diabetic mouse obtained before and 17 h after injection of PGC-GdDTPA-F. The area of the pancreas is outlined. Note the increase in signal intensity after injection of the contrast agent due to local accumulation of the agent. K, kidney; S, spleen; B. Coronal T1 maps of an STZ-induced diabetic mouse obtained before and 1, 17, and 40 h after injection of PGC-GdDTPA-F. The area of the pancreas is color-coded based on its T1 relaxation time. P, pancreas; S, spleen; V, stomach; C. Quantitative analysis of T1 relaxation times of the pancreata of STZ-induced diabetic and control mice. There was a drop in the T1 of the pancreata at 1 h after injection of PGC-GdDTPA-F. This drop was most significant at 17 h after injection and was followed by a gradual increase, consistent with contrast agent washout. T1 map analysis demonstrated a significant difference in the T1 of the pancreata between diabetic and control animals at 1 and 17 h after injection of PGC-GdDTPA-F, reflecting a higher accumulation of the contrast agent in diabetic pancreata. **P<0.05. Reproduced with permission from American Diabetes Association (23)

