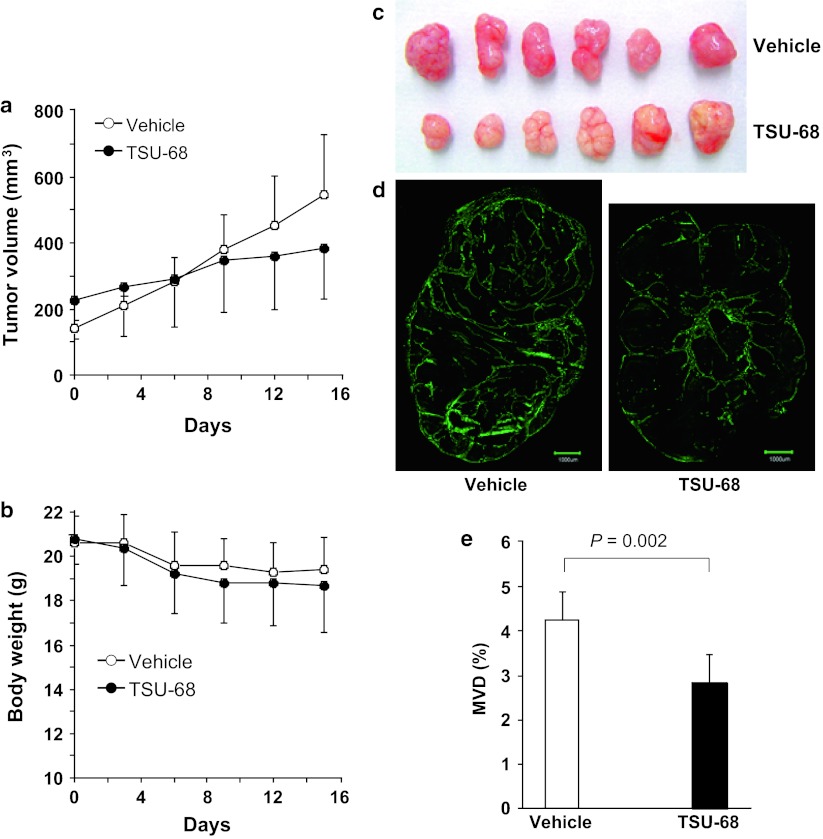
Fig. 3.
a Tumor growth curve of s.c. HuH-7 tumor-bearing mice treated with daily i.p. injections of TSU-68 (75 mg kg−1 d−1 in 50 μl of DMSO) or the vehicle alone (50 μl of DMSO). Data are presented as the mean ± SD of tumor volumes. Day 0: the day before treatment; days 1–14: treatment days; day 15: 1 day after treatment. b Changes in the body weight of TSU-68- and vehicle-treated mice. c Image of TSU-68- and vehicle-treated tumors excised on day 15. d Representative immunofluorescence staining of tumor sections from TSU-68- and vehicle-treated tumors using anti-mouse CD31 antibody (green). Scale bar = 1,000 μm. e The tumor MVD presented as the percentage of the CD31-positive area was compared between tumors from TSU-68- and vehicle-treated mice. All data presented in a–e are from the same set of experimental groups (n = 6 for each group)

