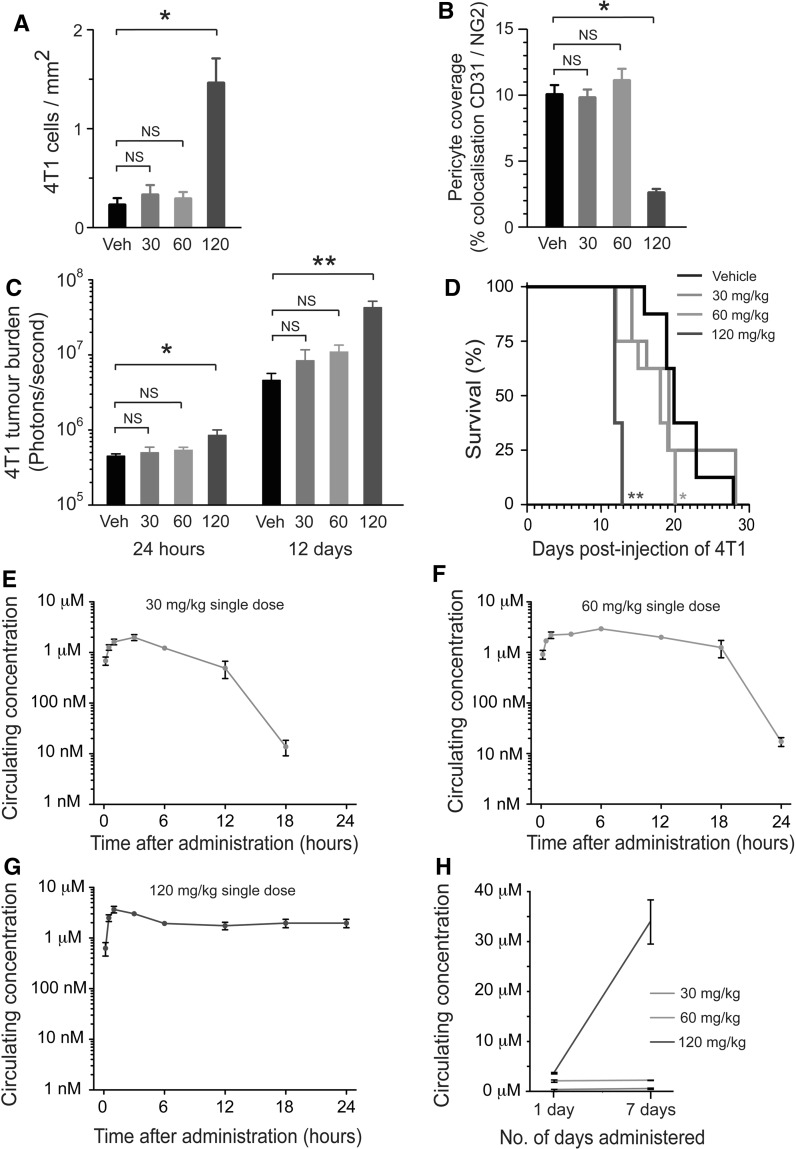
Fig. 3.
Enhanced seeding of metastasis is sunitinib dose-dependent. a–d Dose-dependent effects of sunitinib. Balb/c mice were pre-treated with 30, 60 or 120 mg/kg/day sunitinib or vehicle for 7 days, followed by intravenous injection of 4T1-luc tumour cells. a Quantification of tumour cells seeded in the lung at 24 h post tumour cell injection in mice pre-treated with the indicated dose of sunitinib. Bar graph shows number of cells counted per mm2 of lung tissue section ± SEM. *P = 0.01, n = 8 mice per treatment group. b Quantification of pericyte coverage in the normal lung vasculature at 24 h post-injection of tumour cells in mice pre-treated with the indicated dose of sunitinib. Bar graph shows percentage colocalisation between CD31 and NG2 ± SEM. *P = 0.0001, n = 8 mice per treatment group. c Bioluminescence signal at 1 day or 12 days post tumour cell injection in mice pre-treated with the indicated dose of sunitinib ± SEM, *P = 0.01, **P = 0.002, n = 8 mice per treatment group. d Kaplan–Meier analysis of overall survival is shown in mice pre-treated with the indicated dose of sunitinib. *P = 0.03, **P = 0.0001, n = 8 mice per group. e–h Pharmacokinetics of sunitinib. Balb/c mice were administered a single oral dose of 30 mg/kg (e), 60 mg/kg (f) or 120 mg/kg (g) sunitinib. At the indicated times after dosing, blood samples were collected and the plasma concentration of sunitinib was determined. n = 4 mice per time point. h Balb/c mice were administered a single dose of sunitinib at 30, 60 or 120 mg/kg or were administered sunitinib at 30, 60 or 120 mg/kg every day for 7 days. At 12 h after administration of a single sunitinib dose, or at 12 h after administration of the seventh dose of sunitinib, blood samples were collected and the plasma concentration of sunitinib was determined. n = 4 mice per time point, NS = no significant difference

