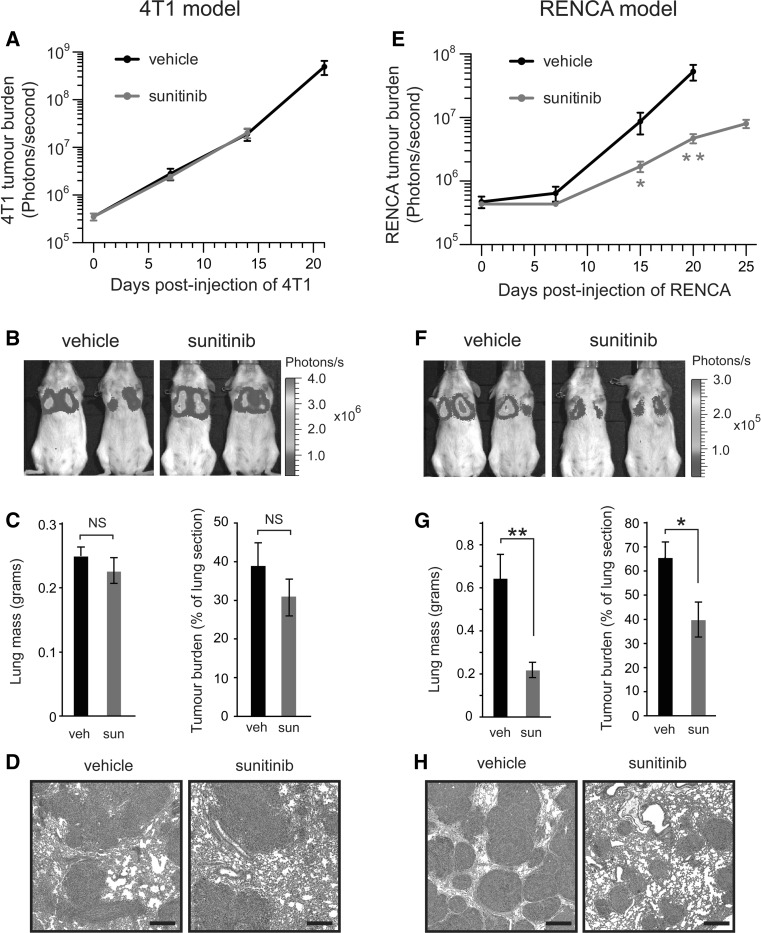
Fig. 5.
Lung tumour burden in mice treated with sunitinib after intravenous injection of tumour cells. Balb/c mice were injected intravenously with 4T1-luc or RENCA-luc tumour cells and then treated with daily vehicle (veh) or 60 mg/kg/day sunitinib (sun) on a continuous dosing schedule. a, e Lung tumour burden was quantified in 4T1-luc (a) or RENCA-luc (e) tumour bearing mice. Graphs show bioluminescence signal at the indicated time points after injection of tumour cells ± SEM. Note that the difference in duration over which bioluminescence is monitored for each experimental group is due to the difference in the overall survival observed in each group. *P = 0.02, **P = 0.004, n = 8 mice per treatment group. b, f Representative bioluminescence images of 4T1-luc (b) or RENCA-luc (f) tumour bearing mice at 14 days (4T1-luc) or 15 days (RENCA-luc) after tumour cell injection. c, g Tumour burden was quantified in 4T1-luc (c) or RENCA-luc (g) tumour bearing mice at 14 days (4T1-luc) or 18 days (RENCA-luc) after tumour cell injection by weighing lungs or by quantitative histology. Graphs show lung mass ± SEM or percentage area of lung section occupied by tumour ± SEM. *P = 0.01, **P = 0.0001, n = 8 mice per treatment group. d, h Representative fields of H&E stained sections of lung from 4T1-luc (d) or RENCA-luc (h) tumour bearing mice at 14 days (4T1-luc) or 18 days (RENCA-luc) after tumour cell injection. Scale bar = 400 μM, NS = no significant difference

