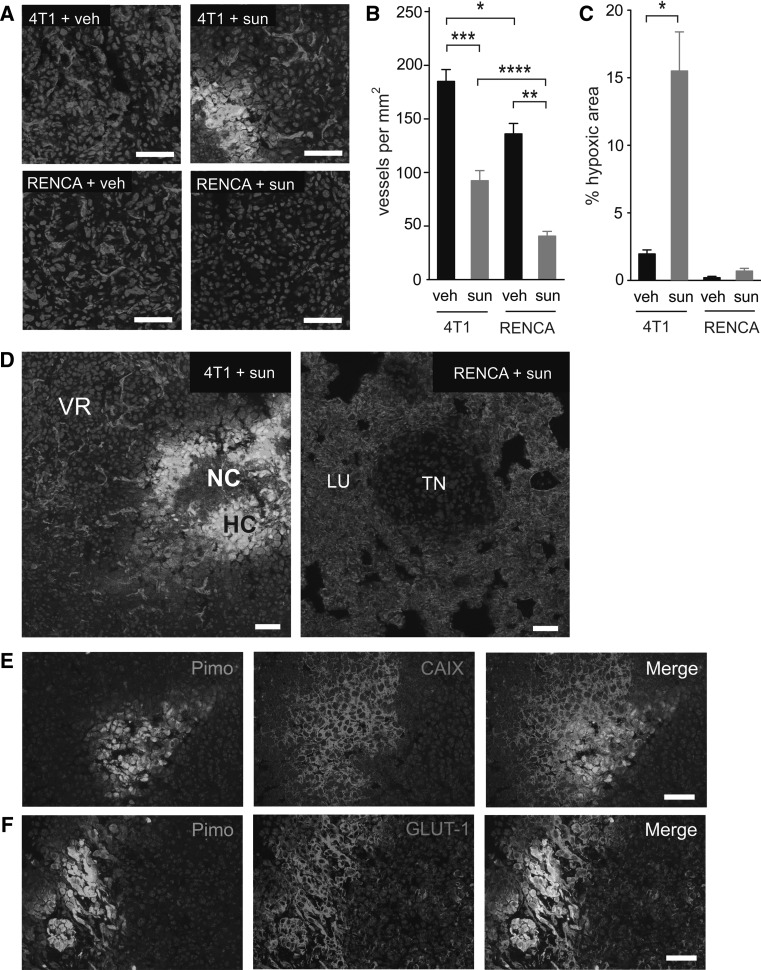
Fig. 7.
Quantification of tumour vascularisation and tumour hypoxia. Balb/c mice were injected intravenously with 4T1 or RENCA cells and then treated with vehicle (veh) or 60 mg/kg/day sunitinib (sun) for 14 days, at which time point mice were culled and lungs were collected for histological analysis. a Representative fields of CD31 (red), pimonidazole (green) and DAPI (blue) staining in 4T1 and RENCA tumour nodules from vehicle or sunitinib treated mice as indicated. b Quantification of microvessel density in tumour nodules. Graph shows number of vessels per mm2 ± SEM. *P = 0.015, **P = 0.008, ***P = 0.0003, ****P = 0.0004, n = 8 mice per treatment group. c Quantification of pimonidazole staining in tumour nodules. Graph shows percentage area of the tumour nodules that stained positive for pimonidazole ± SEM. *P = 0.001, n = 8 mice per treatment group. d Left panel low power view of a 4T1 lung tumour nodule from a sunitinib treated mouse. Right panel low power view of a RENCA lung tumour nodule from a sunitinib treated mouse. Staining is for CD31 (red), pimonidazole (green) and DAPI (blue). VR, vascular rim; HC, hypoxic core; NC, necrotic core; TN, tumour nodule; LU, normal lung. e, f Co-staining for pimonidazole and CAIX (e) or GLUT-1 (f) in 4T1 tumours. NS = no significant difference, Scale bar = 50 μM. (Color figure online)

