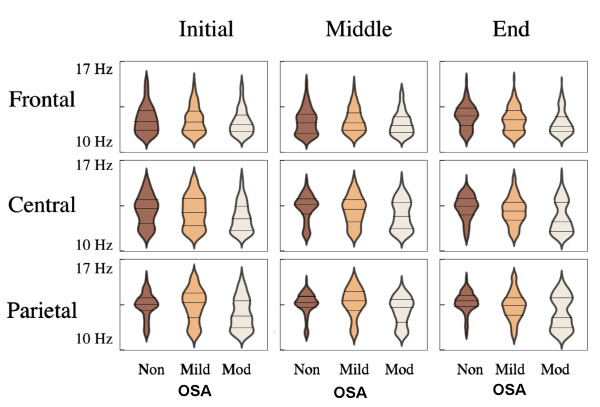
Figure 2.
Sleep spindle frequency distributions represented through violin plots [[38]], with shape width expressing spindle count grouped within 0.12Hz juxtaposed class intervals according to central frequency. Distributions were largely non-unimodal. Compared to non-OSA subjects, in the beginning of the night, Moderate OSA patients showed larger contributions of slow spindles in central and parietal regions. As the night progressed, Moderate OSA patients showed spindle frequency changes that were topography-specific, with a relative reduction in the proportion of slow spindles in central and parietal regions (especially in the intermediate night section) whereas in frontal regions, sleep spindles remained slow. Horizontal marks indicate median and interquartile ranges. Non, non-OSA; Mod, moderate OSA.

