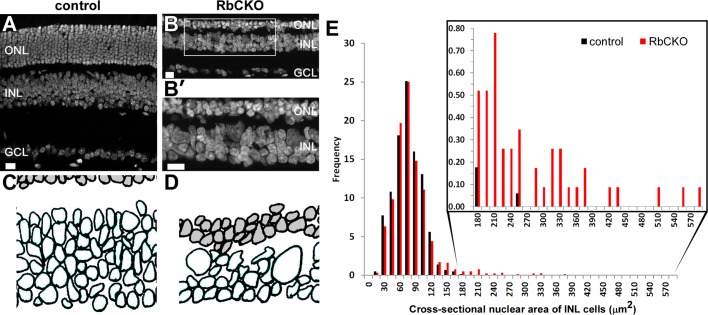
FIGURE 2:
Morphometric analysis of INL cells. (A, B) SYTOX green counterstained sections were used to hand trace the nuclear outlines of cells in the INL. (B′) Boxed area in B shows large and irregularly shaped nuclei in the INL of RbCKO retina. (C, D) Representative digitized images from traced SYTOX Green–labeled nuclei were used to calculate the cross-sectional nuclear area of INL cells (unshaded) for control (Six3-Cre+;Rb1lox/+; C) and RbCKO (D) retinas at P26. (E) Frequency histogram showing the distribution of cross-sectional nuclear area for cells in the INL of control (black) and RbCKO retinas (red). Cells from RbCKO show a distribution that extends toward much larger areas (inset). Scale bars, 20 μm.

