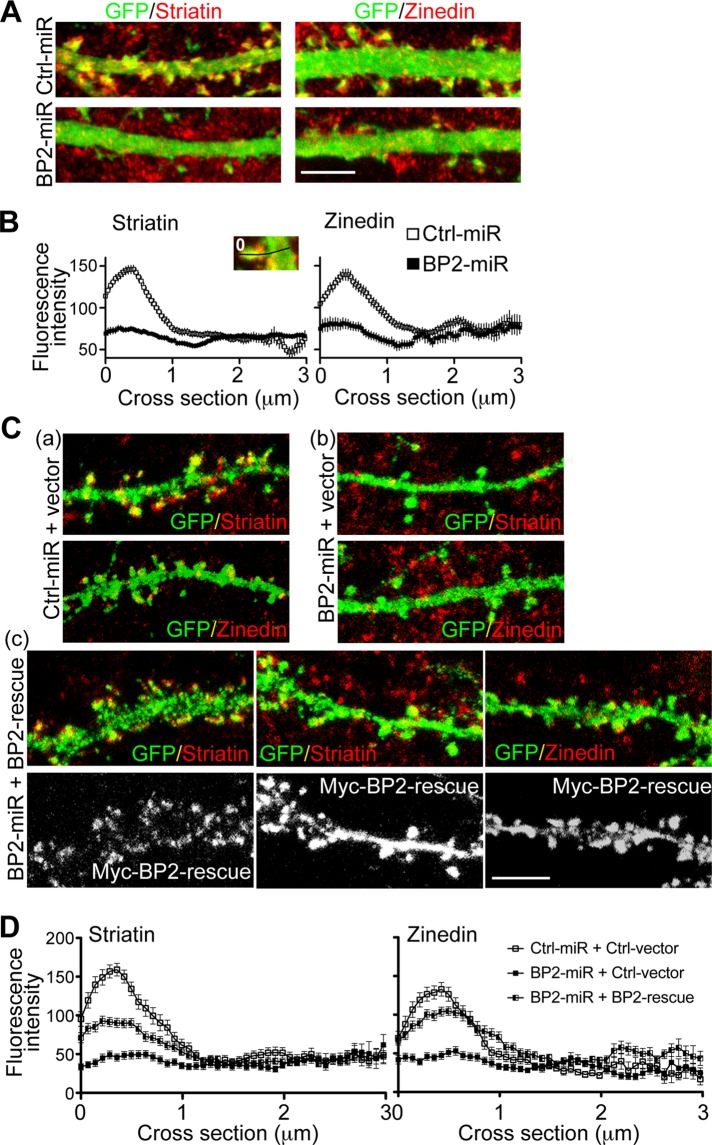
FIGURE 7:
Knockdown of CTTNBP2 reduces the dendritic spine distribution of striatin and zinedin. (A) Rat hippocampal neurons were transfected with Ctrl-miR or BP2-miR at 12 DIV and stained at 18 DIV using anti-striatin (left) or anti-zinedin (right) antibodies. The GFP signals highlight the dendritic morphology. (B) Quantitative analysis of striatin (left) or zinedin (right) distribution. In the higher magnification of a spine (inset), the line indicates the path for line scanning, which starts from the tip of the spine (set as 0) and crosses the dendritic shaft. The means ± SEM of the fluorescence intensities along the scanning path are provided. More than 30 spines from seven neurons were analyzed for each group. (C, D) Dendritic spine distribution of striatin and zinedin were rescued by expression of Myc-tagged BP2-rescue construct, which is resistant to BP2-miR. The experiment was carried as described in A and B, except that one more group of neurons cotransfected with BP2-miR and BP2-rescue was included for analysis. To make the DNA amounts equal, vector control was also included as indicated. Note that the expression levels of BP2-rescue construct are not identical among transfected neurons. One BP2-rescue lower-expressing cell and two BP2-rescue higher-expressing cells are shown in Cc. Scale bar, 5 μm.

