
FIGURE 2:
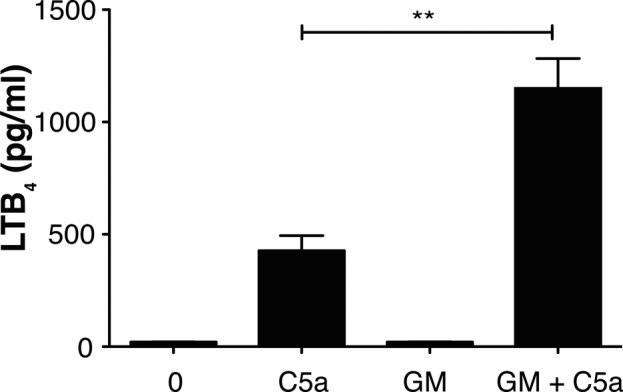
Priming and activation of PMNs for LTB4 production. PMNs were analyzed for LTB4 synthesis 5 min after stimulation with 100 nM C5a or after priming with 1 ng/ml GM-CSF for 60 min before the addition of C5a. Alternatively, cells were primed for 60 min with GM-CSF alone or left unstimulated (0) before analysis. Cells were centrifuged, and the supernatants were removed and analyzed by EIA for LTB4. Data are represented as mean ± SEM from four separate experiments. Data analysis was performed using one-way ANOVA followed by Bonferroni's multiple comparison test, where p < 0.05 is significant. Unpaired Student's t test was performed to obtain p values. **p = 0.0028 for C5a vs. GM-CSF + C5a. p < 0.05 for C5a and GM-CSF + C5a vs. unstimulated.