
Fig. 1.
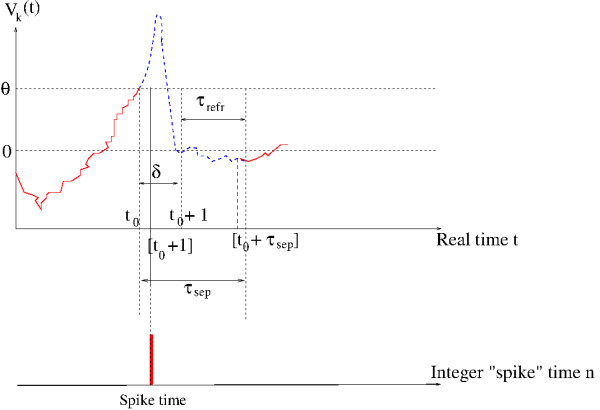
Time course of the membrane potential in our model. The blue dashed curve illustrates the shape of a real spike, but what we model is the red curve.
Official websites use .gov
A
.gov website belongs to an official
government organization in the United States.
Secure .gov websites use HTTPS
A lock (
) or https:// means you've safely
connected to the .gov website. Share sensitive
information only on official, secure websites.
Time course of the membrane potential in our model. The blue dashed curve illustrates the shape of a real spike, but what we model is the red curve.