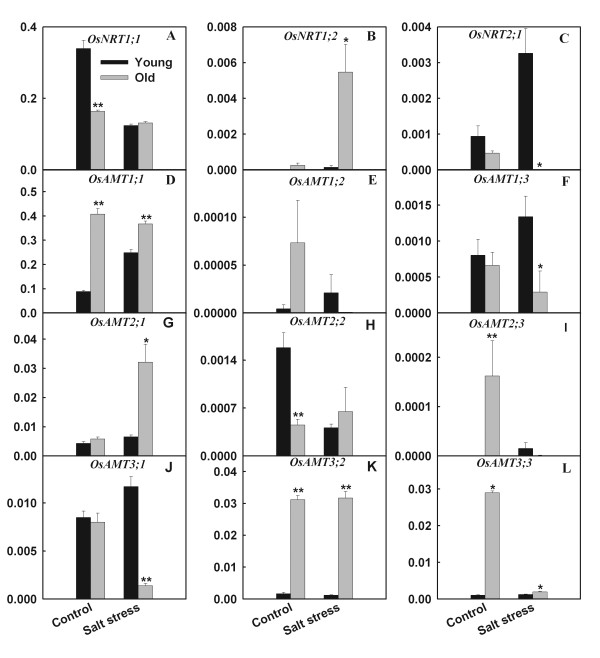
Figure 6.
Effects of salt stress on the expression (relative units) of OsAMT and OsNRT gene families in young and old leaves of rice seedlings. The values are means (± SE) of four biological replicates, and each replicate consisted of a pool of 10 plants. Statistically significant between organs at same stress condition was determined by t-test, and marked as * (P < 0.05) and ** (P < 0.01).

