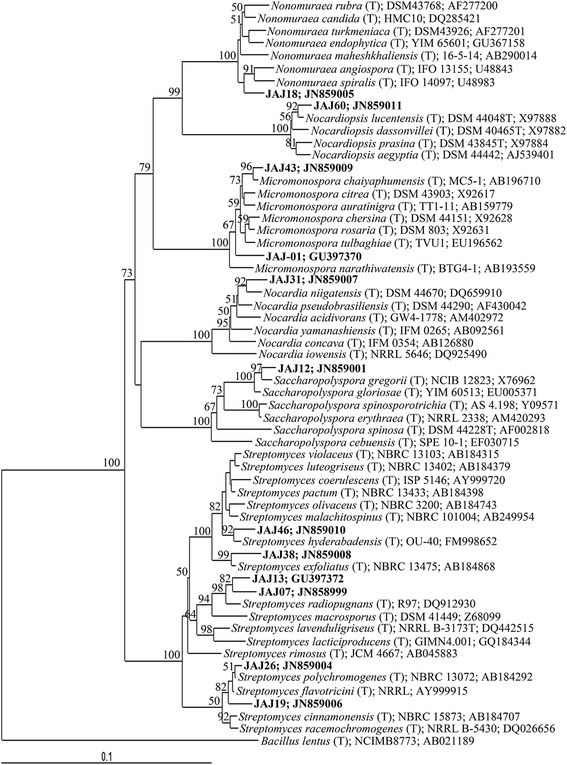
Figure 2 .
Neighbour-joining phylogenetic tree inferred from 16S rRNA gene sequences. The phylogenetic tree shows the phylogenetic relationship of isolates with related genera. Bootstrap values are expressed as percentages of 1000 replications. Bootstrap values, >50% are shown at branch points. Bacillus lentusT (GenBank accession number AB021189) was used as out-group. Score bar represents 1 nucleotide substitution per 100 nucleotides.

