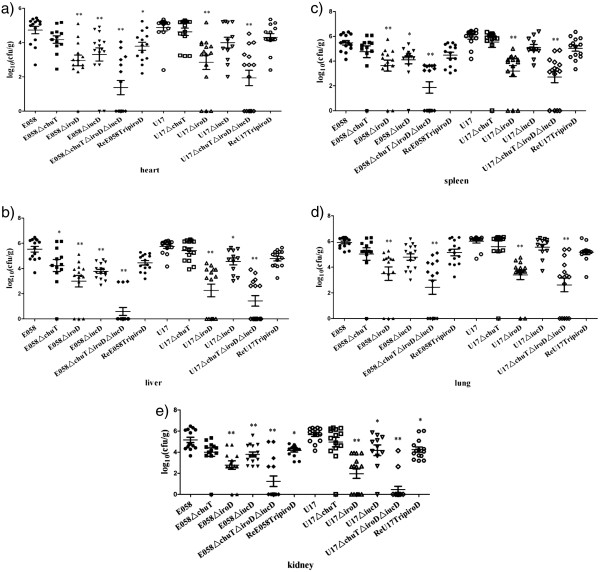
Figure 1.
Colonization in organs of chickens challenged with APEC E058, UPEC U17, or their isogenic mutants in the single-strain challenge model. Data are presented as log10(CFU/g) of tissues. Horizontal bars indicate the mean log10 CFU.g-1 values. Each data point represents a tissue sample from an individual infected chicken at 24h post-infection. Organs sampled were the heart (a), liver (b), spleen (c), lung (d), and kidney (e). Statistically significant decreases in bacterial loads are indicated with asterisks (*, P<0.05; * *, P<0.01).

