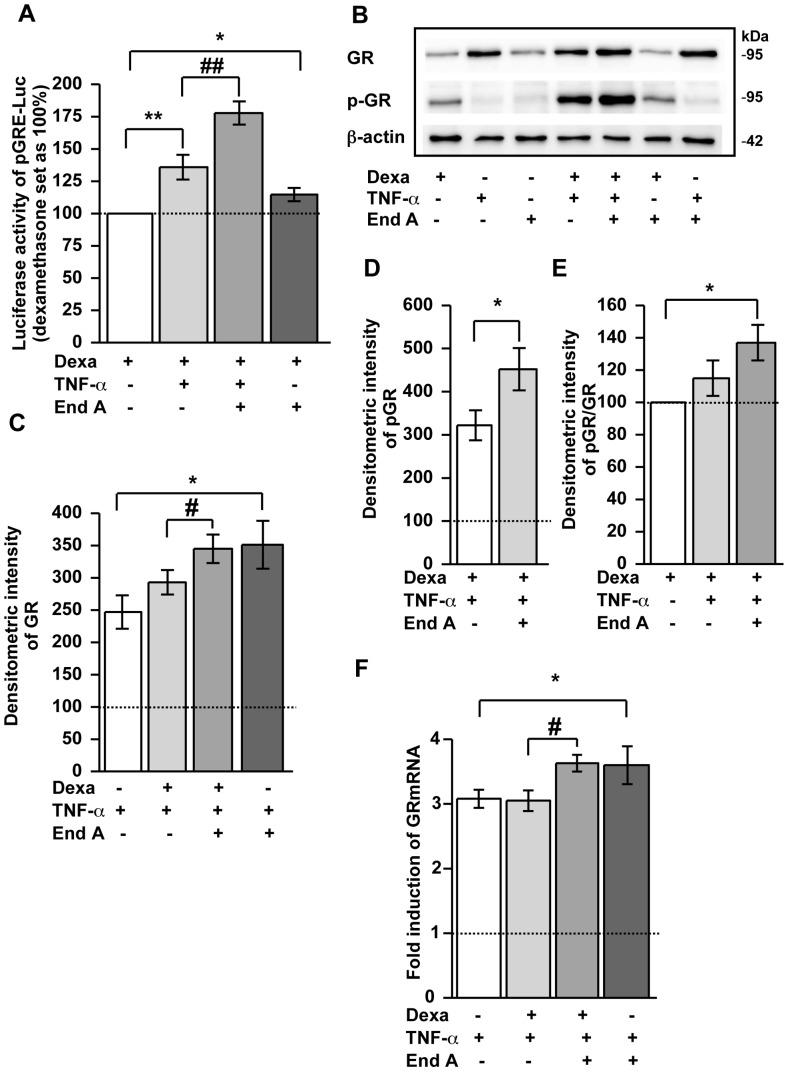
Figure 3. Endiandrin A increased activation of a GRE-driven luciferase construct and GR protein levels in HT-29/B6-GR cells.
(A) HT-29/B6-GR cells were transfected with pGRE-Luc and incubated with dexamethasone (1 µM) and/or TNF-α (500 IU/ml) and/or endiandrin A (20 µM) for 24 hours. Data are given as normalized relative luciferase activity and as means ± s.e.m., n = 6–14 * P<0.05, ** P<0.01 compared with dexamethasone alone, ## P<0.01 compared with dexamethasone + TNF-α 500 IU/ml. (B) Western blot analysis of total GR and phospho-GR protein (∼95 kDa) of HT-29/B6-GR cell lysates incubated with dexamethasone (1 µM) and/or TNF-α (500 IU/ml) and/or endiandrin A (20 µM) for 3 hours. Human β-actin (∼42 kDa) served as a loading control. (C) Densitometry of total GR chemiluminescence signals. Shown are means ± s.e.m., n = 5, *P<0.05 compared to TNF-α alone, # P<0.05 compared with dexamethasone + TNF-α 500 IU/ml. (D) Densitometry of phospho-GR chemiluminescence signals. Shown are means ± s.e.m., n = 5, *P<0.05 compared with dexamethasone + TNF-α 500 IU/ml. (E) Densitometry of phospho-glucocorticoid receptor chemiluminescence signals normalized to total glucocorticoid receptor. Shown are means ± s.e.m., n = 5, *P<0.05 compared with dexamethasone. (F) GR mRNA expression of HT-29/B6-GR cells incubated with dexamethasone (1 µM) and/or TNF-α (500 U/ml) and/or endiandrin A (20 µM) for 3 hours. GR mRNA level was analyzed by real-time PCR. Data are means ± s.e.m. of x-fold induction of GR expression over that of untreated controls, n = 7–8, *P<0.05 compared to TNF-α alone, # P<0.05 compared with dexamethasone + TNF-α 500 IU/ml.

