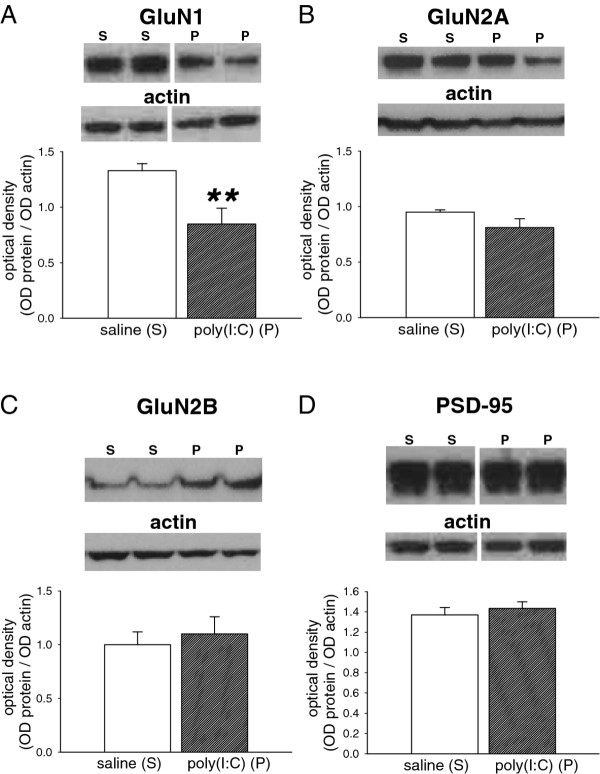
Figure 4.
Expression of NMDA receptor-associated proteins. Bar charts showing the quantified expression of (A) GluN1 (M.W. 130 kDa) (B) GluN2A (M.W. 180 kDa) (C) GluN2B (M.W. 180 kDa) and (D) PSD-95 (M.W. 95 kDa) in the brains of P21 rat offspring after treating the mothers with poly(I:C) 10 mg/kg on days E14, E16 and E18 of gestation. The bars indicate the mean ± s.e.mean (n = 6, except GluN1 poly(I:C) where n = 5) in arbitrary units of optical density (OD) expressed as the ratio of test protein to actin. Sample western blots above each chart illustrate the data obtained from animals exposed to the saline vehicle (S) or poly(I:C) (P) and show the relevant protein and the corresponding actin blot used as a housekeeping marker ** P < 0.01.

