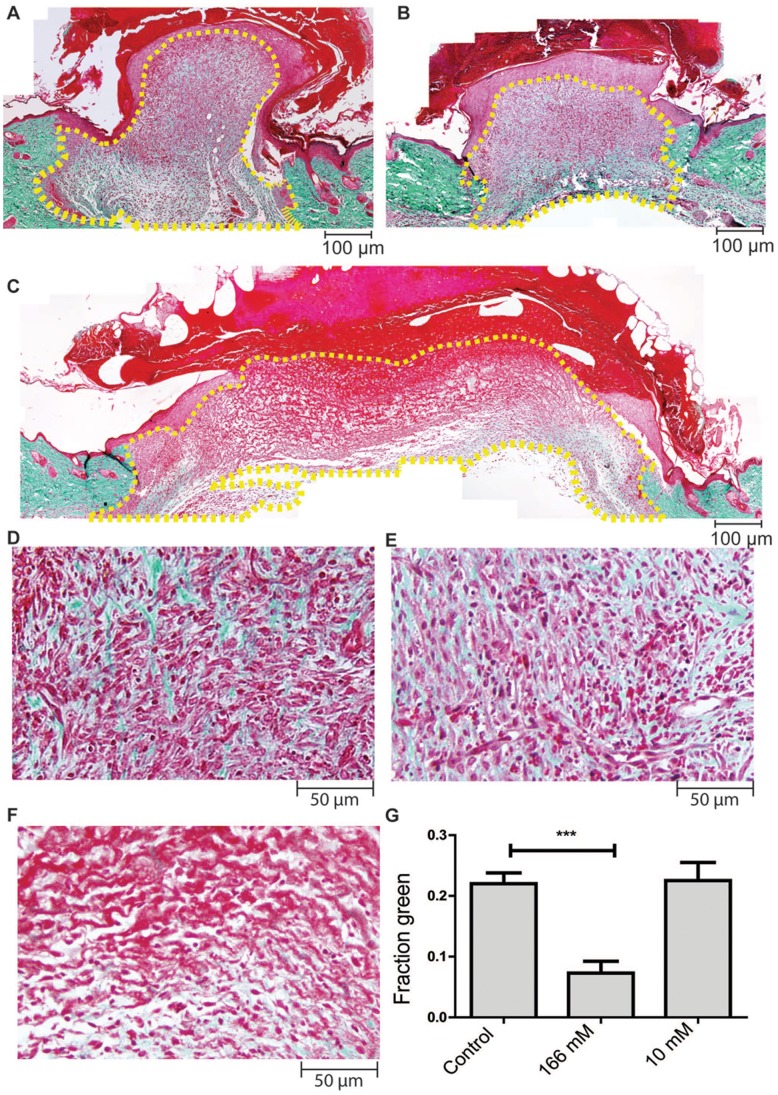
Figure 2. High concentrations of H2O2 retard connective tissue formation.
Paraffin sections from day 6 wounds were stained with the Masson-Goldner trichrome stain as described in material and method. Connective tissues are stained green. Fibrin, eschar and cytoplasm are stained red. Nuclei are stained dark brown. Representative images for control (A,D) 10 mM (B, E) and 166 mM (C, F) treated wounds are shown. Images A-C are at 100X magnification while D-F are at 200X magnification. (G) Quantification of the fraction of pixels that are stained green. The number of pixels stained green within the neodermis at 100X magnification was quantified using a custom software. The area quantified is outlined with the dashed line. Results were analyzed using 1-way ANOVA followed by Dunnett’s multiple comparison test with control. Graph shown is the mean ± S.E.M. n = 6–7, *** p<0.001.

