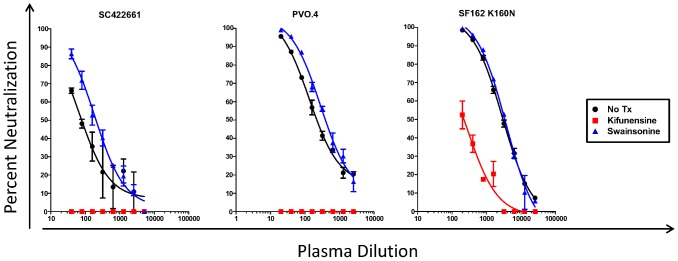
Figure 3. Neutralization of kifunensine- or swainsonine-treated viruses by AC053 plasma collected at 5.31 yrs post infection.
The percent neutralization of viruses produced in 293 T cells either in the presence or absence of 20 µM kifunensine or swainsonine glycosidase inhibitors (as described in the Materials and Methods) was determine at a given plasma dilution. Black circles – no treatment, red squares – kifunensine treatment, blue triangles – swainsonine treatment.

