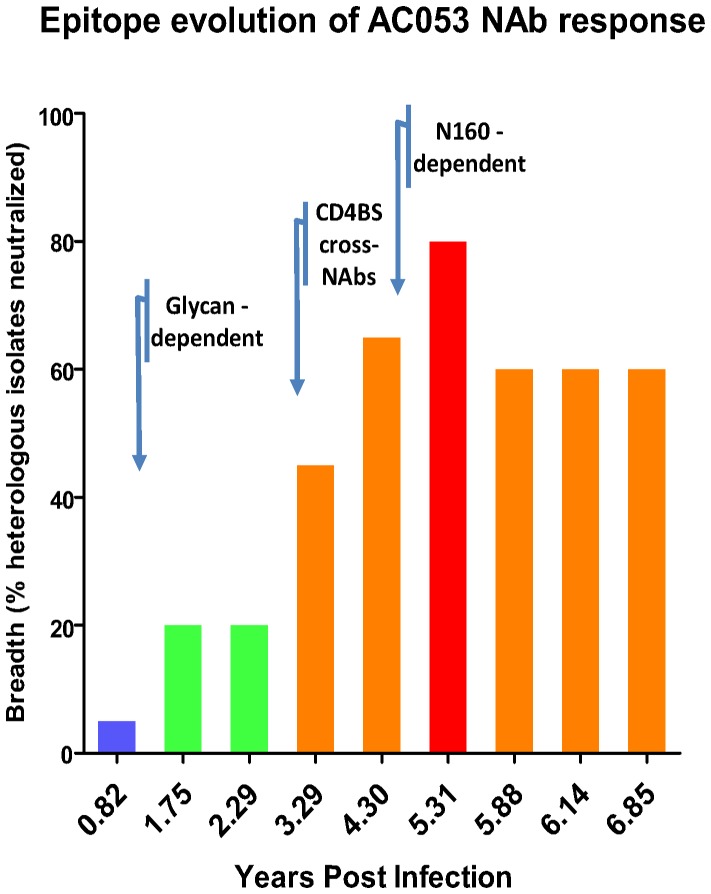
Figure 6. Timeline of the epitope evolution of cross-reactive NAb responses in AC053.
The breadth of neutralizing antibody responses (i.e., the percent of heterologous isolates neutralized by plasma samples out of the total isolates tested [14]), was plotted for all available time-points for subject AC053. The arrows on the timeline correspond to approximate years post infection when particular neutralizing antibody specificities became evident. Breadth is color-coded as follows: blue 0–19%, green 20–39%, orange 40–74%, red 75–100%.

