
Figure 1. The donor fluorescence decay is an indicator of the distribution of FRET efficiency values in a population. A.
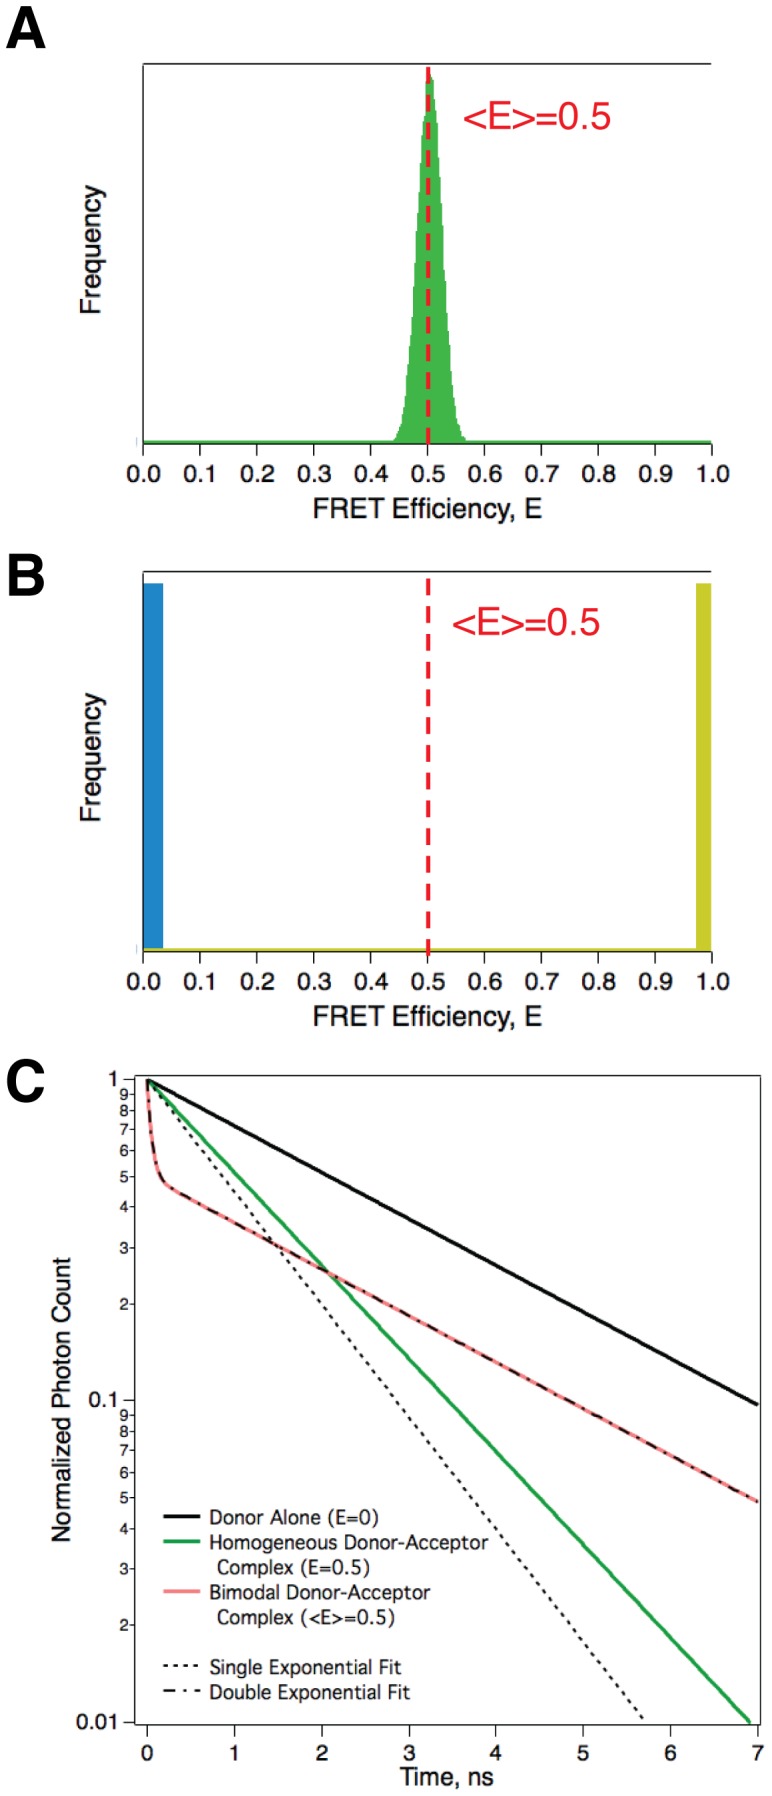
Simulated distribution of FRET efficiencies for a narrow normally distributed RDA population, 〈 E 〉 = 0.5. B. Simulated distribution of FRET efficiencies for a bimodal population with E = 0 & 1. C. Fluorescence decays from the populations depicted in panels A and B. For comparison the decay of donors in the absence of acceptors is also plotted (Black trace). Note that the decay of the population depicted in panel B (RED trace) was poorly fit by a single exponential decay model (dotted line), but was well fit using a double exponential decay model (dashed and dots line).