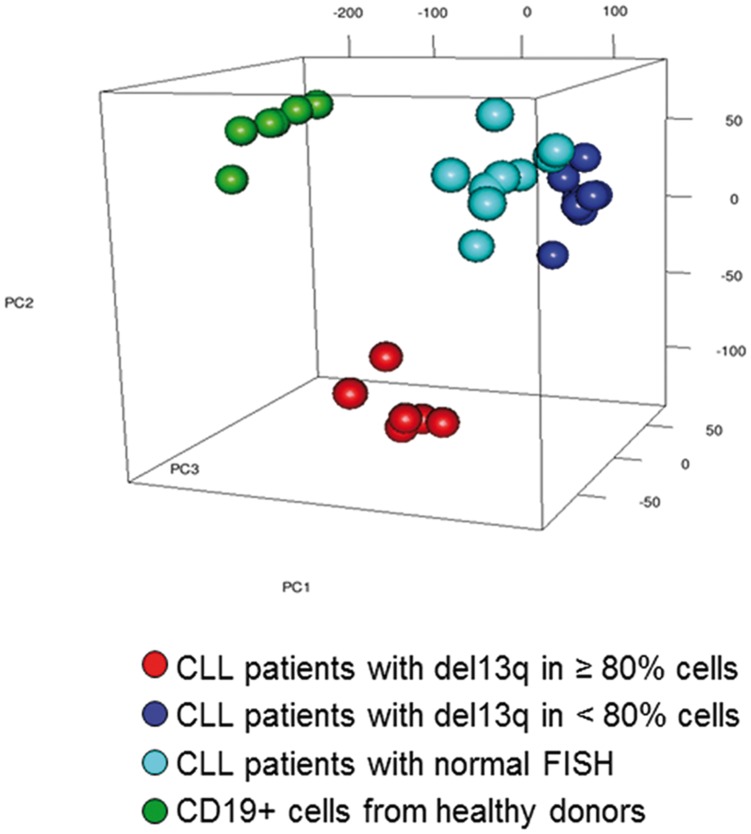
Figure 5. CLL patients with a high number of 13q- cells can be differenciated based on their expression profile.
Principal component analysis (PCA) plot of CD19+cells from healthy controls (green), CLL with normal FISH (sky blue), 13q-H CLL (red) and 13q-L CLL (dark blue) was carried out using the 28,806 remaining genes after filtering the normalized gene expression matrices to remove the least variable genes (25%). Each sphere represents a single GEP. The result of the PCA shows a cumulative variance of 48.3%, 60.9% and 68.3% corresponding to one, two or three of the initial components, respectively. The expression pattern of CD19+cells from CLL patients is notably different from the gene expression profile of CD19+cells from healthy donors. Of note, the PCA analysis shows that 13q-H CLL patients have a distinctive gene expression profile. By contrast, the gene expression of B lymphocytes from 13q-L CLL and nCLL was similar.

