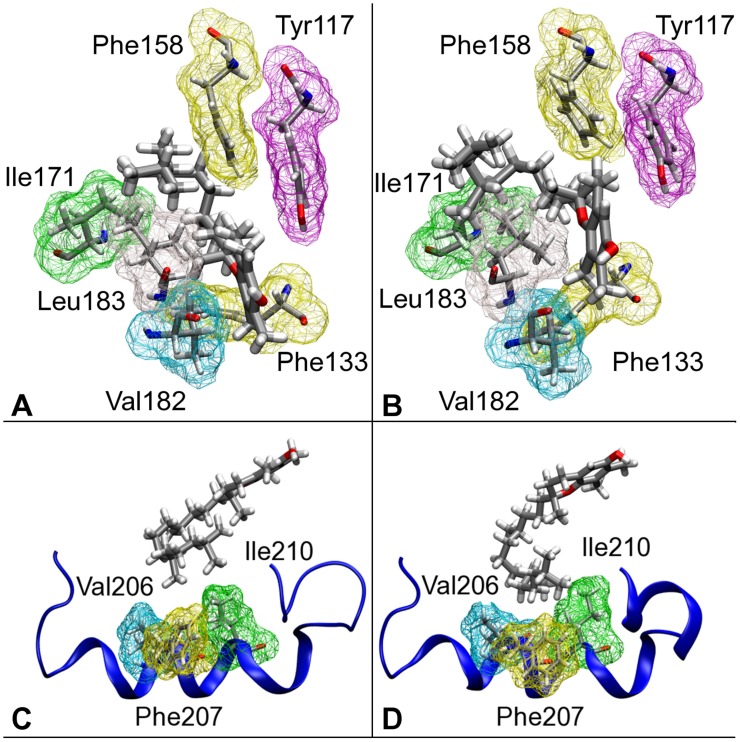
Figure 4. Comparison between hydrophobic contacts in WT.
 -T (left panels (A, and C)) and WT
 -T (right panels (B, and D)). Top panels (A, B): the van der Waals space occupied by residues in the binding pocket is highlighted by the wireframe representation. The different conformation of the hydrophobic tail in
  -T and
  -T is evidenced. Lower panels (C, D): comparison between the interaction of
  -T (C) and
  -T with the helical mobile gate of the WT protein.

