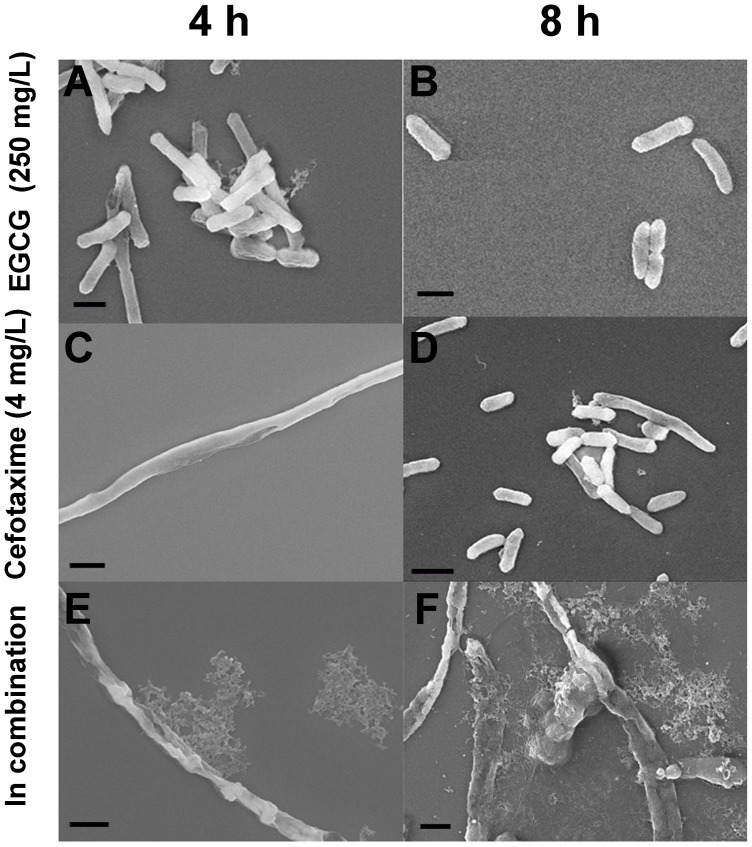
Figure 2. SEM images of ESBL-EC treated with sub-MICs of EGCG, cefotaxime or their combinations.
Cells were: treated with 250 mg/L of EGCG for 4 h (A) and 8 h (B); treated with 4 mg/L of cefotaxime for 4 h (C) and 8 h (D); and treated with 250 mg/L of EGCG and 4 mg/L of cefotaxime in combination for 4 h (E) and 8 h (F). Scale bar: 1 µm.

