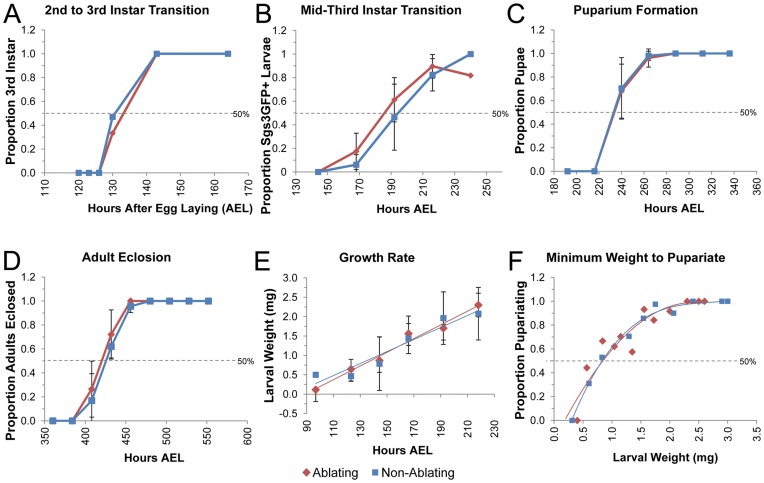
Figure 2. Timing of Developmental Transitions in Larvae Reared at 18.
°C. (A–F) Ablating genotype (w*; rnGAL4, UAS-egr, tubGAL80ts/Sgs3GFP) is shown in Red. Non-Ablating genotype (w*; TM6, Tb1, tubGAL80/Sgs3GFP) is shown in Blue. All larvae were maintained at 18°C. (A) Fraction of larvae of the indicated genotype that had ecdysed to the 3rd Larval Instar is plotted relative to time in hours After Egg Laying (AEL). (B) Fraction of larvae of the indicated genotype that had reached the mid-third transition (as measured by Sgs3GFP expression) is plotted relative to hours AEL. (C) Fraction of larvae of the indicated genotype that had undergone pupariation is plotted relative to hours AEL. (D) Fraction of larvae of the indicated genotype that had eclosed as adults is plotted relative to the time in hours AEL. (E) Plot of average larval weight (mg) at a given time after egg laying for Ablating and Non-Ablating larvae. (F) Fraction of larvae that underwent pupariation after starvation at a given size for Ablating and Non-Ablating larvae.

