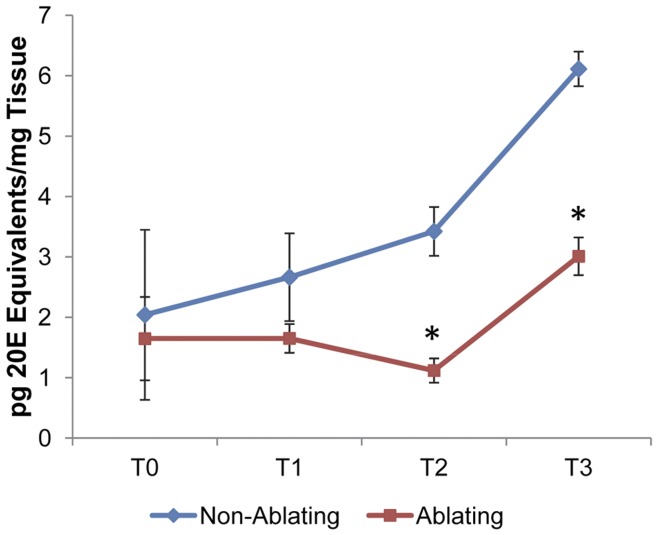
Figure 6. Ecdysteroid Titers Following Wing Disc Cell Ablation.
Ecdysteroid titers measured for larvae of Ablating (Red) and Non-Ablating (Blue) genotypes at time points T0–T3 (See Figure 1B), as determined by EIA. Values are expressed as the means of 20E equivalents per mg of tissue. Error bars indicate the SEM (n = 2 samples of 15 larvae each). Asterisks indicate differences statistically significant at p≤0.05 (t-test).

