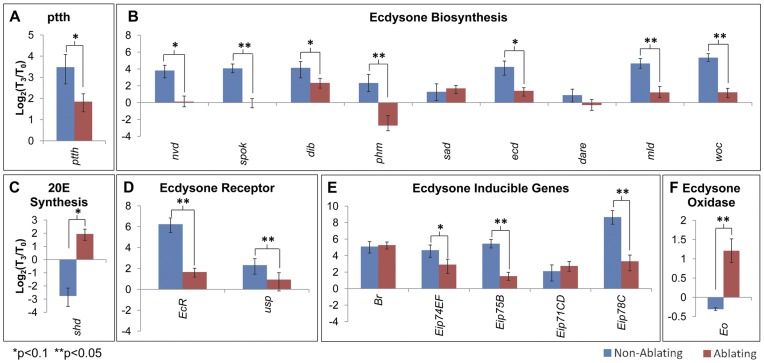
Figure 7. Effects of Tissue Damage on Ecdysone Biosynthesis and Signaling.
qRT-PCR analysis of transcript levels of (A) ptth, (B) genes required for ecdysone synthesis, (C) shd, (D) ecdysone inducible genes, (E) ecdysone receptor components and (F) ecdysone oxidase. Graphs show changes in transcript levels 24 hours after heat treatment (T3; Figure 2B) compared to transcript levels immediately before heat treatment (T0; Figure 2B). Ablating (Red - w*/w1118; rnGAL4, UAS-egr, tubGAL80ts/+). Non-Ablating (Blue - w*/w1118; TM6, Tb1, tubGAL80/+).

