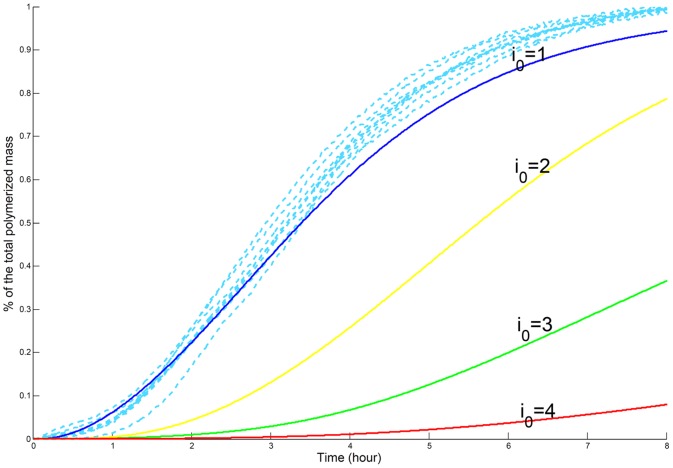
Figure 2. Simulation vs Experiments for Experimental Set 1, for an initial PolyQGST concentration of  .
.
The parameters were first estimated for an experimental set of initial concentration  then we compared the experimental measures (dotted lines) for an initial concentration
  with the simulations (in solid lines) for
  We see that the smaller
  is, the closer the simulation to experimental curves.

